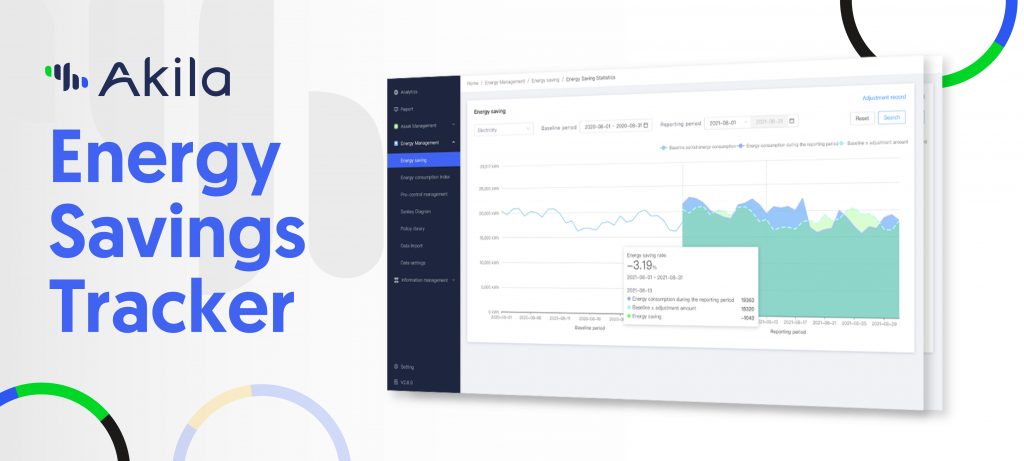
Feature: Energy Savings Tracker
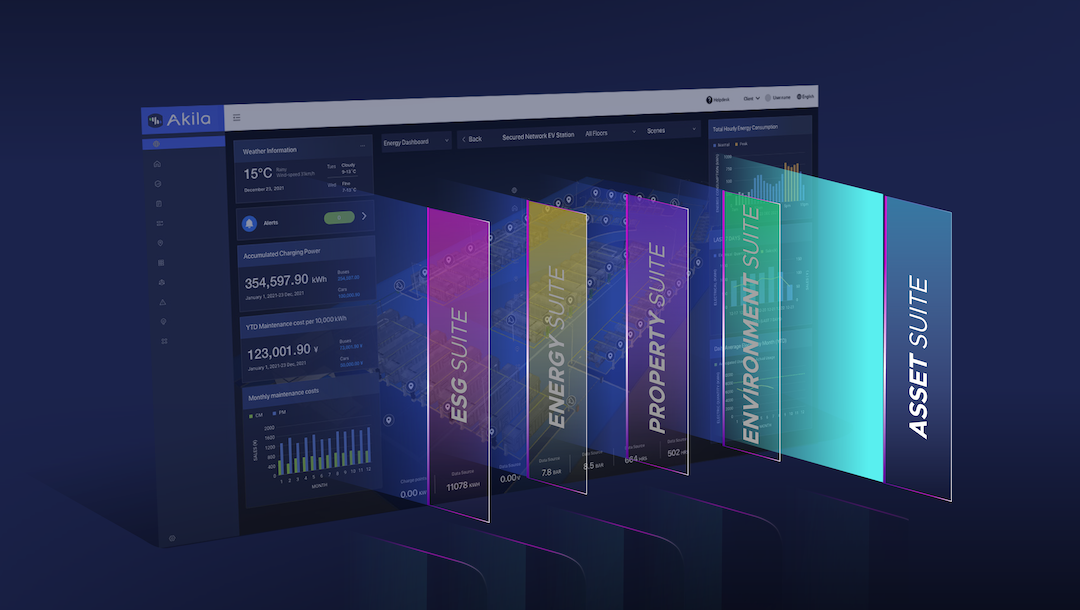
Module: Akila Energy
Key benefits:
- Designed according to internationally recognized standards (IPMVP)
- Automated calculation and display of carbon impact
- Granular (equipment-level) measurement of energy use and savings
- Live data collection, with continual feed into user dashboard and analytics.
What doesn’t get measured doesn’t get managed
Everyone knows that energy savings and carbon-cutting go hand-in-hand. But practical experience shows that many companies with the best intentions and most ambitious targets often fall into traps along the way to optimization.
For starters, there is the initial challenge of getting a verifiable baseline of energy consumption – a measure of how much energy your facilities, assets and equipment are consuming before the energy optimization project kicks off. Then, there is the matter of systemically measuring the impact of changes you have made. This is no small task considering the number of systems, pieces of equipment and the sheer volume of the data involved.
The fact is that many companies with the best of intentions remain held back by the limits of their data measurement and validation infrastructure. This is precisely the type of challenge Akila and its Energy Savings Tracker is designed to overcome.
Spreadsheets aren’t up to the job
As much as data technology has advanced, a surprisingly high percentage of energy optimization projects are still recorded and measured through Excel or a similar spreadsheet program. This is far from ideal and creates a number of vulnerabilities for project managers and their companies:
Delays between measurement and action: The complexity and slow speed of data collection and entry limits companies to only periodic measurement and analysis of their data. Energy inefficiency may still be spotted, but only after a period of unnecessary waste and carbon production.
Difficulty scaling: Without the right platform, each measurement you add requires an upping of time and resources, while also increasing the risk of error (see the below).
Difficulty zooming in: It’s one thing to see overall consumption, but what about pinpointing or comparing performance in individual pieces of equipment. This can be done in a spreadsheet, but it’s hardly user-friendly and done less often for just this reason.
Hard to validate and spot errors: Simply put, spreadsheets have no smart or automated way to validate the accuracy of the data they contain and major limitations on automated updating of data. Accuracy in this system comes down to human effort and talent, which comes under more and more strain as the number of assets, systems and facilities being measured grows.
Akila’s Energy Savings Tracker: a smarter, simpler way to measure impact
There is a better way and it is already operational on the Akila platform. In fact, the team at Akila just upgraded Energy Savings Tracker’s feature set, enabling Akila users to have a dramatically more accurate, granular and streamlined view of their energy savings data.
1. Compliant with international standards
The Energy Savings Tracker is designed for systemic compliance with the standards of IPVMP (International Performance Measurement and Verification Protocol), which is considered the international gold standard for energy efficiency projects. This means that whether users are reporting emissions for local government compliance, or to global HQ in another country, your data will be valid, verified and recognized.
2. Set a comprehensive, digitalized baseline
There are two main ways to set a baseline, and Akila integrates both through our simulation technologies and energy-specialist network.
- Historical data: any records already existing, energy billing records, historical meter data etc. This typically requires an audit and involvement from our energy specialists in order to gather data and build a model inside the platform.
- Simulated data: Smart modelling to calculate your predicted energy use and expected performance of your building.
3. Real-time data and analytics in a user-friendly dashboard
Akila gives facility and portfolio managers a central location for all this data, with clear carbon and energy-efficiency assessments from the level of whole portfolios, individual facilities (very important for benchmarking if you have a large portfolio) and individual chillers, boilers., etc.
Because Akila tracks your data in a live feed located right in the dashboard, alongside analytics, users can look at energy use across any time frame, with any level of granularity. From the whole system to a single boiler, from peak load to downtime, from an hour to a year—Akila’s Energy Tracker enables users to accurately assess the energy and carbon impact of their projects.
A growing toolkit for savings tracking
As we continue to add features in the future, Akila will strengthen its integration of its equipment-tracking and CMMS features, allowing for fault detection and smart diagnostics on equipment and assets. Akila will simplify the management of both maintenance and energy reduction, while continually expanding the opportunities for users to measure and document their carbon reduction and overall.