Most buildings already generate huge amounts of energy and operational data. Electricity consumption, HVAC loads, occupancy levels, runtime hours, production activity and equipment behaviour are constantly being tracked.
The problem is not data scarcity. The problem is interpretation.
A rise in energy use can mean many different things. It may reflect higher occupancy, extended operating hours, increased production demand, hotter weather, changing usage patterns or equipment issues. A drop in consumption can also be misleading if the building is still underperforming relative to the conditions it operated under.
Without operational context, the same energy trend can point to very different conclusions.
Why Trend Lines Only Tell Part of the Story
Many teams still rely on simple comparisons to evaluate energy performance.
Did consumption go up or down? Did this month perform better than last month? Did energy use fall after an efficiency measure was introduced?
These comparisons are useful, but they rarely explain why consumption changed.
A building may implement an energy-saving initiative and still see electricity use rise afterwards. On paper, that can look like failure. But if occupancy also increased significantly during the same period, the building may actually be operating more efficiently than expected.
The opposite can happen too. A site may show lower consumption overall while still wasting more energy than it should under comparable operating conditions. The downward trend looks positive, but the underlying performance may still be drifting.
Historical averages rarely capture how buildings actually operate day to day.
Adding Context to Energy Performance
To understand whether a building is operating efficiently, energy consumption needs to be evaluated alongside the conditions surrounding it.
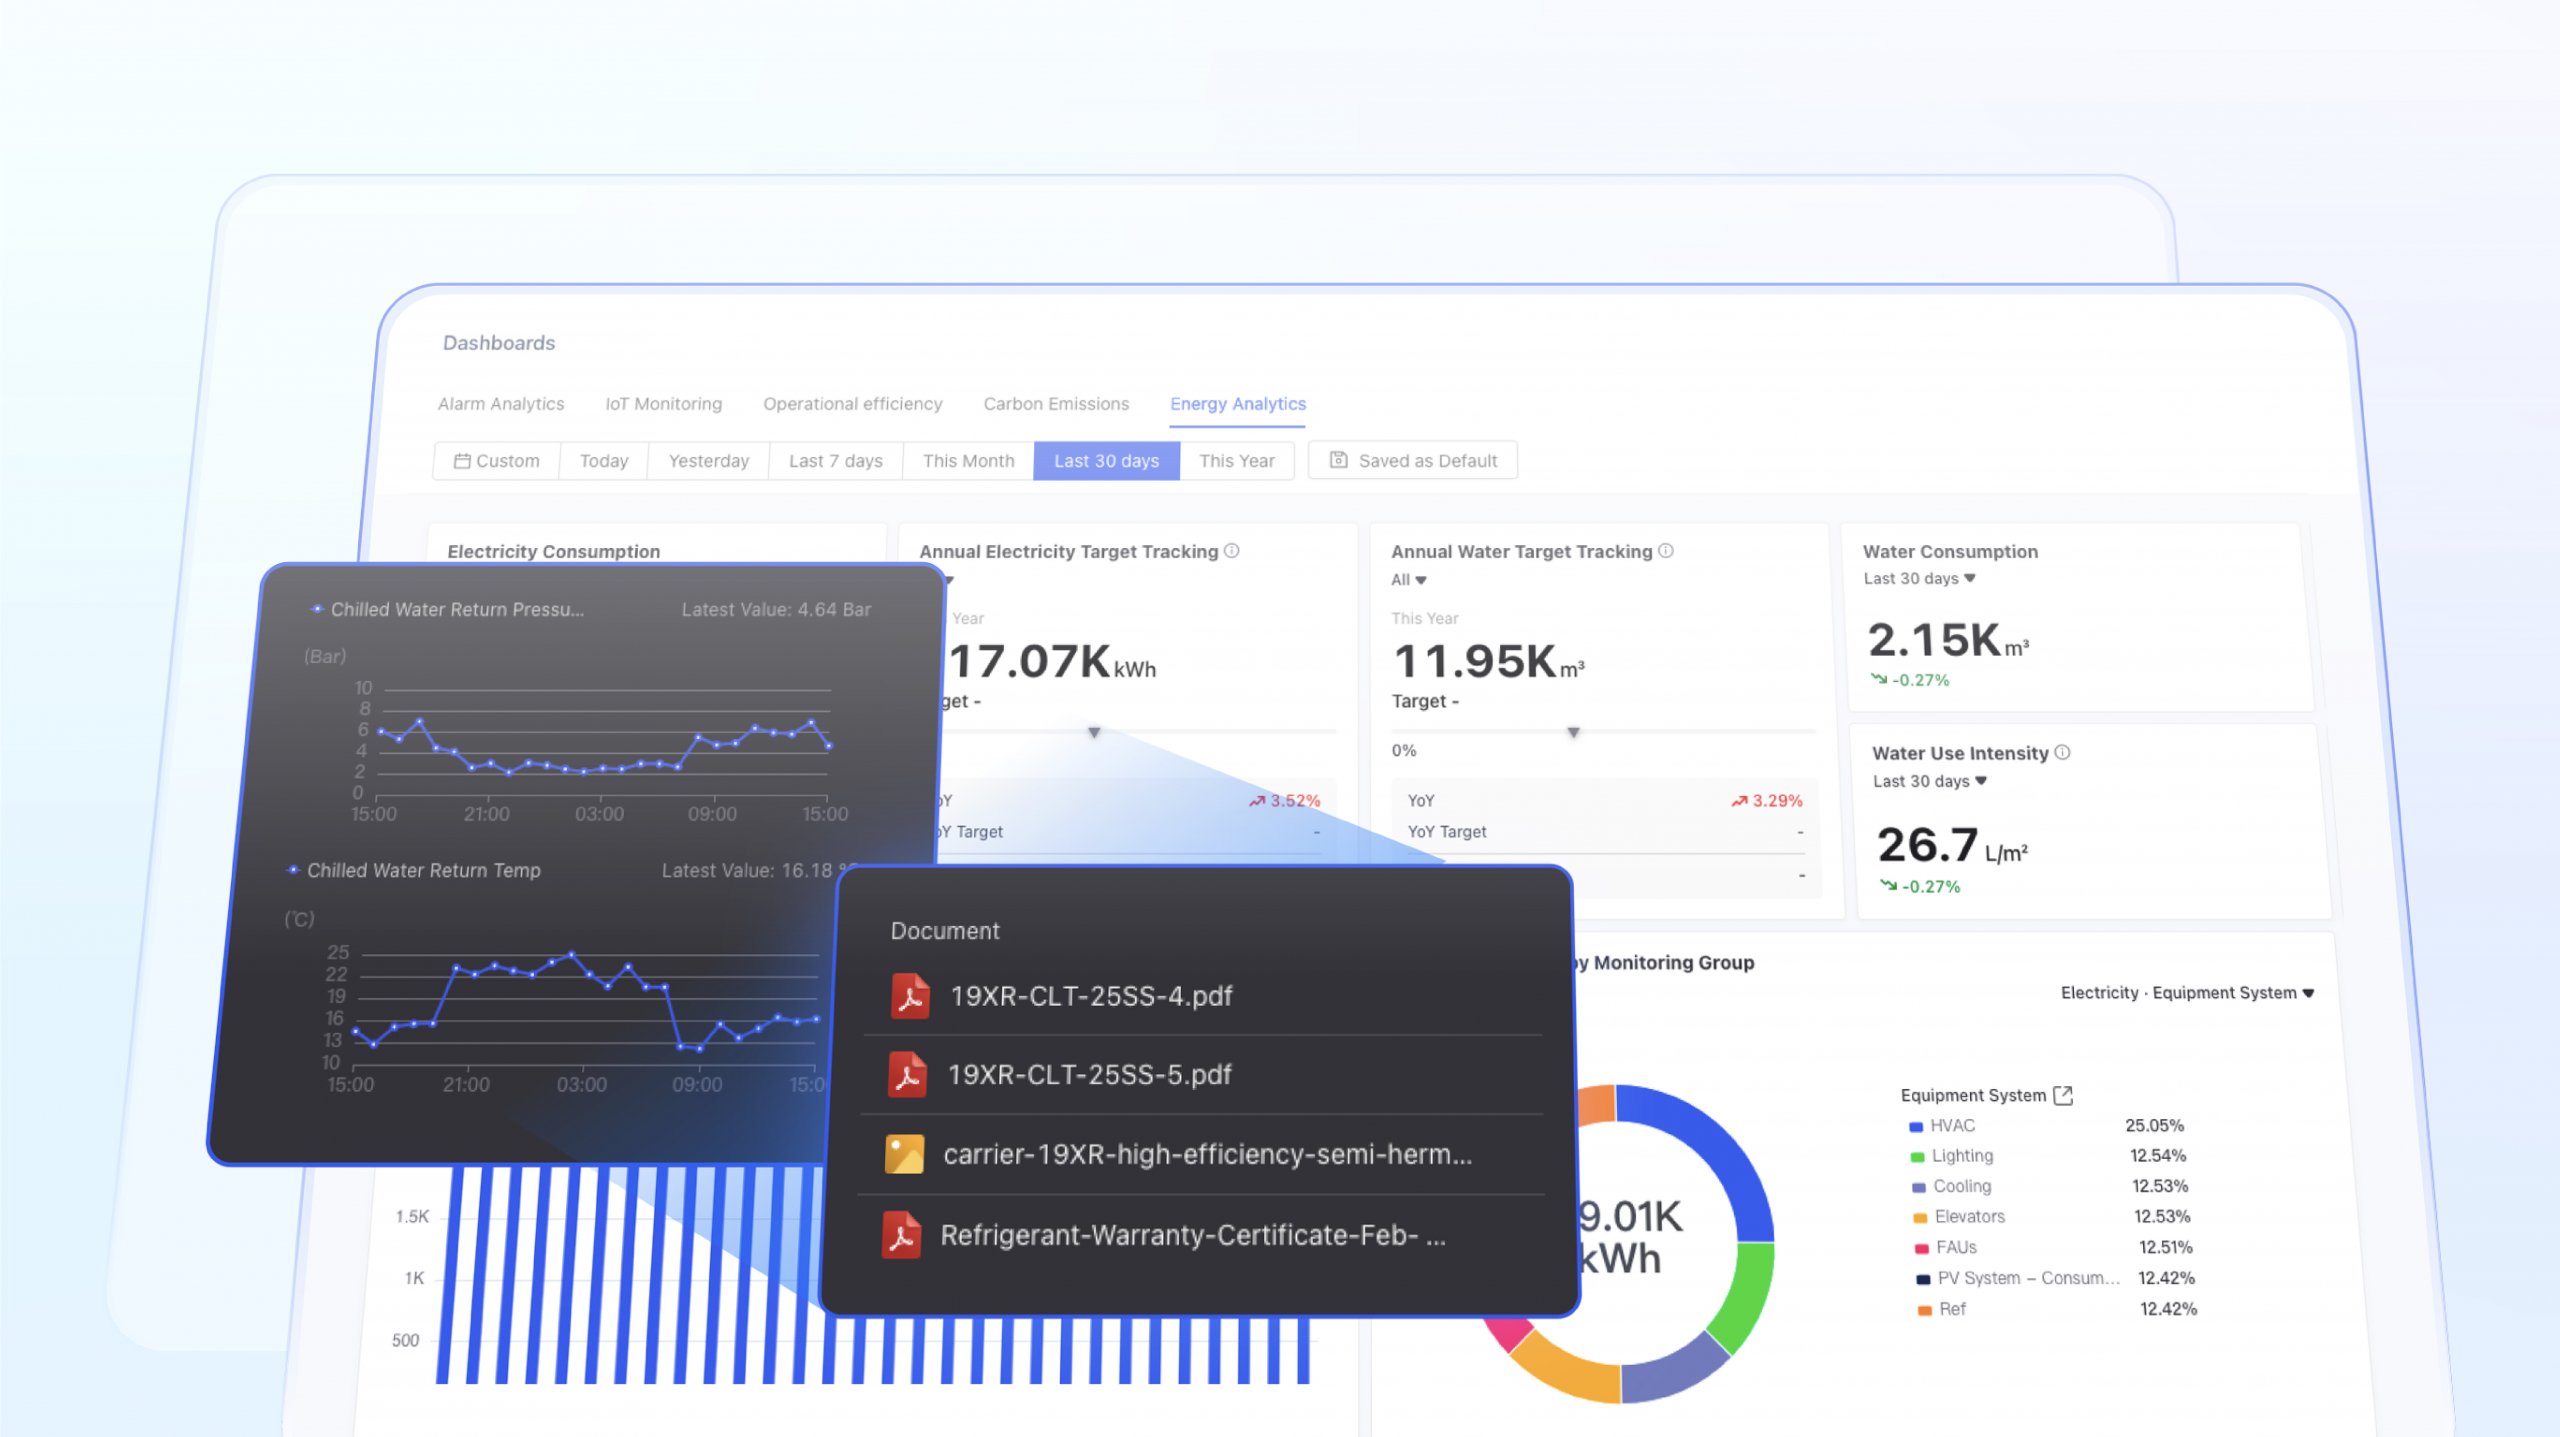
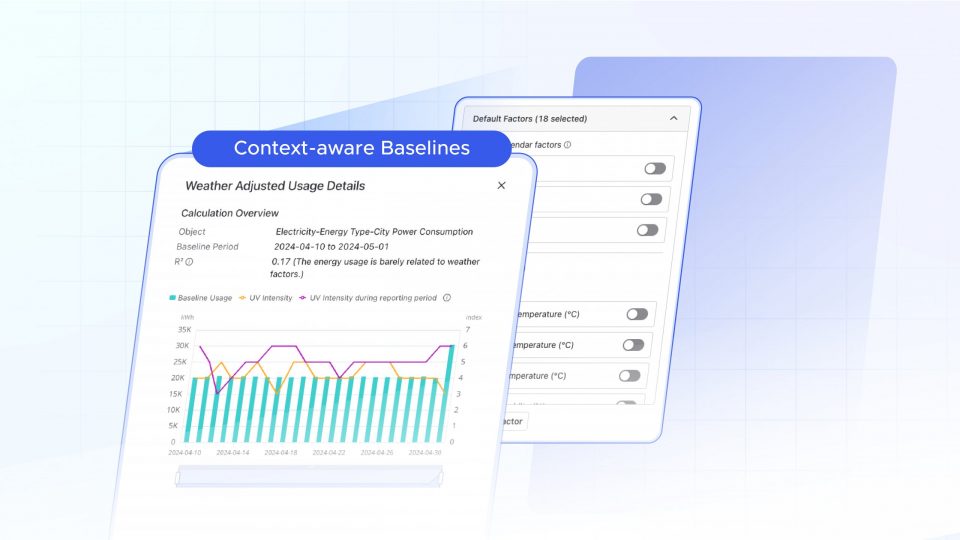
Akila connects energy consumption with the operational variables that shape it, including:
- Weather and environmental conditions
- Occupancy patterns
- Operating hours
- Production schedules and production load
- Equipment runtime and behaviour
- Site-specific operational data
- Additional third-party or custom datasets
Each additional dataset makes the energy picture easier to interpret.
Instead of evaluating consumption in isolation, teams can compare actual performance against expected conditions based on how the building or facility was operating at that moment. That creates a much clearer view of what is happening across the site.
Teams can begin answering questions such as:
- Was this increase expected?
- Is the building becoming less efficient?
- Did the energy-saving measure actually work?
- Which operational factor is driving the change?
- Is this a short-term fluctuation or an emerging issue?
These questions directly affect operational decisions around maintenance, scheduling and energy optimisation.
Finding the Root Cause Faster
Energy issues are often difficult to diagnose because multiple variables change at the same time.
A manufacturing facility may consume more electricity during a production surge. A commercial building may draw more cooling energy during unusually hot weather. A mixed-use site may experience shifting demand patterns as occupancy changes throughout the day.
Without context, these situations can easily be misread. By comparing actual consumption against expected conditions, teams can spot when energy behaviour falls outside normal operating patterns and investigate the likely causes faster.
This also makes it easier to validate whether energy-saving initiatives are producing measurable results.
For example, an efficiency project may not immediately reduce total consumption if occupancy or production demand also increased during the same period. Comparing energy use against expected operating conditions can help teams identify whether the intervention still delivered measurable savings relative to the activity level of the building.
Moving Beyond Monthly Reporting
Many organisations still review energy performance through monthly reports and utility bill analysis. By the time an issue appears clearly, the inefficiency may have already been affecting operations for weeks or months.
With the right operational context, energy data becomes more useful for day-to-day decision-making. Teams can identify abnormal consumption patterns earlier, investigate deviations faster and focus attention where performance is starting to drift.
Akila supports this approach by helping operators:
- Compare actual versus expected energy behaviour
- Detect abnormal consumption patterns
- Investigate root causes faster
- Validate the impact of efficiency measures
- Simulate operational scenarios
- Prioritise areas requiring action
The result is a more practical approach to energy management grounded in how facilities actually operate.
A Clearer Picture of Building Performance
Energy consumption alone rarely tells the full story.
The same spike on a chart can represent operational growth, changing occupancy, seasonal weather patterns, equipment problems or genuine inefficiency depending on the surrounding conditions.
That is why operational context matters. By connecting energy data with the variables that influence it, teams gain a clearer understanding of what changed, why it changed and whether action is required.