At A Glance
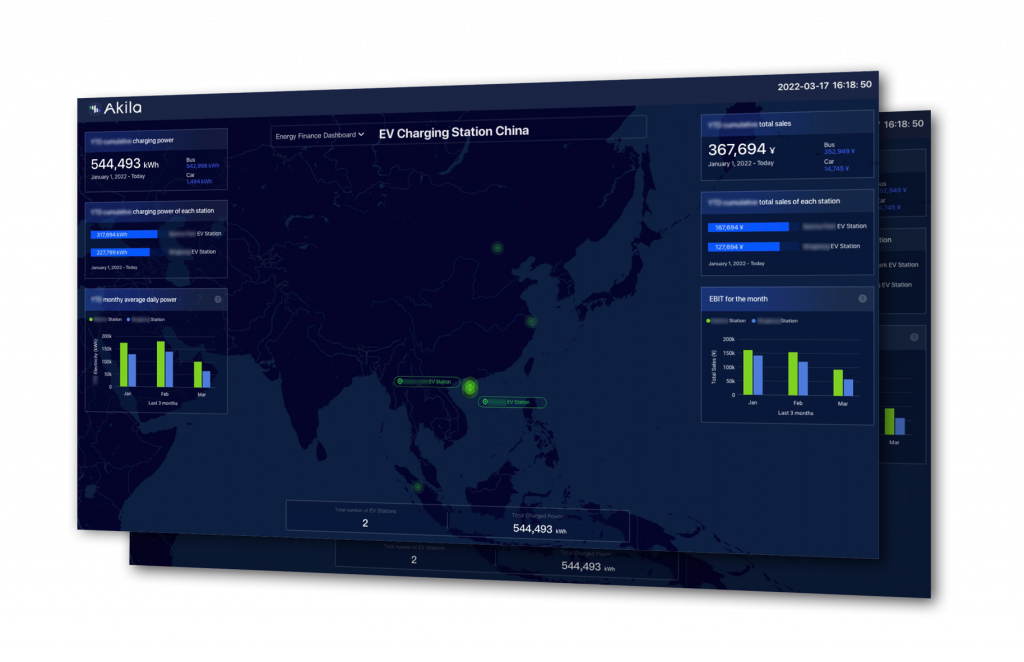
- Portfolio-wide view of financial savings from energy optimization projects
- Calculates using real-time data based on local and sector-specific pricing data
- Energy efficiency projects’ ROI can now be viewed and reported down to the asset level
Introducing the Energy Finance Dashboard
As businesses and governments across the world embark on their journey to net-zero carbon emissions, energy optimization is a top item on every business agenda. Simply put: if you are doing energy efficiency right, you are also boosting your financial efficiency. And the more the interplay of energy and financial savings can be quantified and documented, the more breathing room portfolio managers enjoy to pursue ambitious roadmaps for net-zero carbon and the overall sustainability of their buildings.
Unfortunately, due to the complexity and frequent changes in energy pricing, comprehensively measuring the ROI of energy efficiency projects is often a pain point. Even today, many companies are limited to a side-by-side comparison of monthly utility bills, a mechanism that opens companies to human error and major challenges implementing at scale.
This is why Akila is excited to announce the launch of its Energy Finance Dashboard, the newest addition in a suite of portfolio-performance cockpits in the Akila platform. The Energy Finance Dashboard calculates cost savings portfolio-wide, down to the level of individual pieces of equipment, based on real-time data, AI-based analytics and specific utility rates for each site, based on local regulations and pricing.
What has been holding portfolio managers back?
Energy pricing is a notoriously complex thing to track, subject to a wide range of variables even within one jurisdiction. Time of day or year, regional regulations, industrial sector and energy type are just some of the areas where pricing routinely differs. For portfolio managers, this creates enormous headaches and the challenge of reliably tracking this only grows when extended across regional and national borders.
As mentioned earlier, many companies have been limited to measuring financial returns through a simple comparison of monthly energy billing. While this method may give a view of the overall trend, it does not provide anywhere near the depth needed – no reliable way to zoom in and attribute improvements to specific changes made in a specific building, floor, or piece of equipment. Equally, managers have no way to identify the under-performing elements in their portfolios and quickly make the changes needed to boost savings and cut carbon.
How the Energy Finance Dashboard changes the equation
The Energy Finance Dashboard is built on three pillars, which allow an unprecedented level of detail and management.
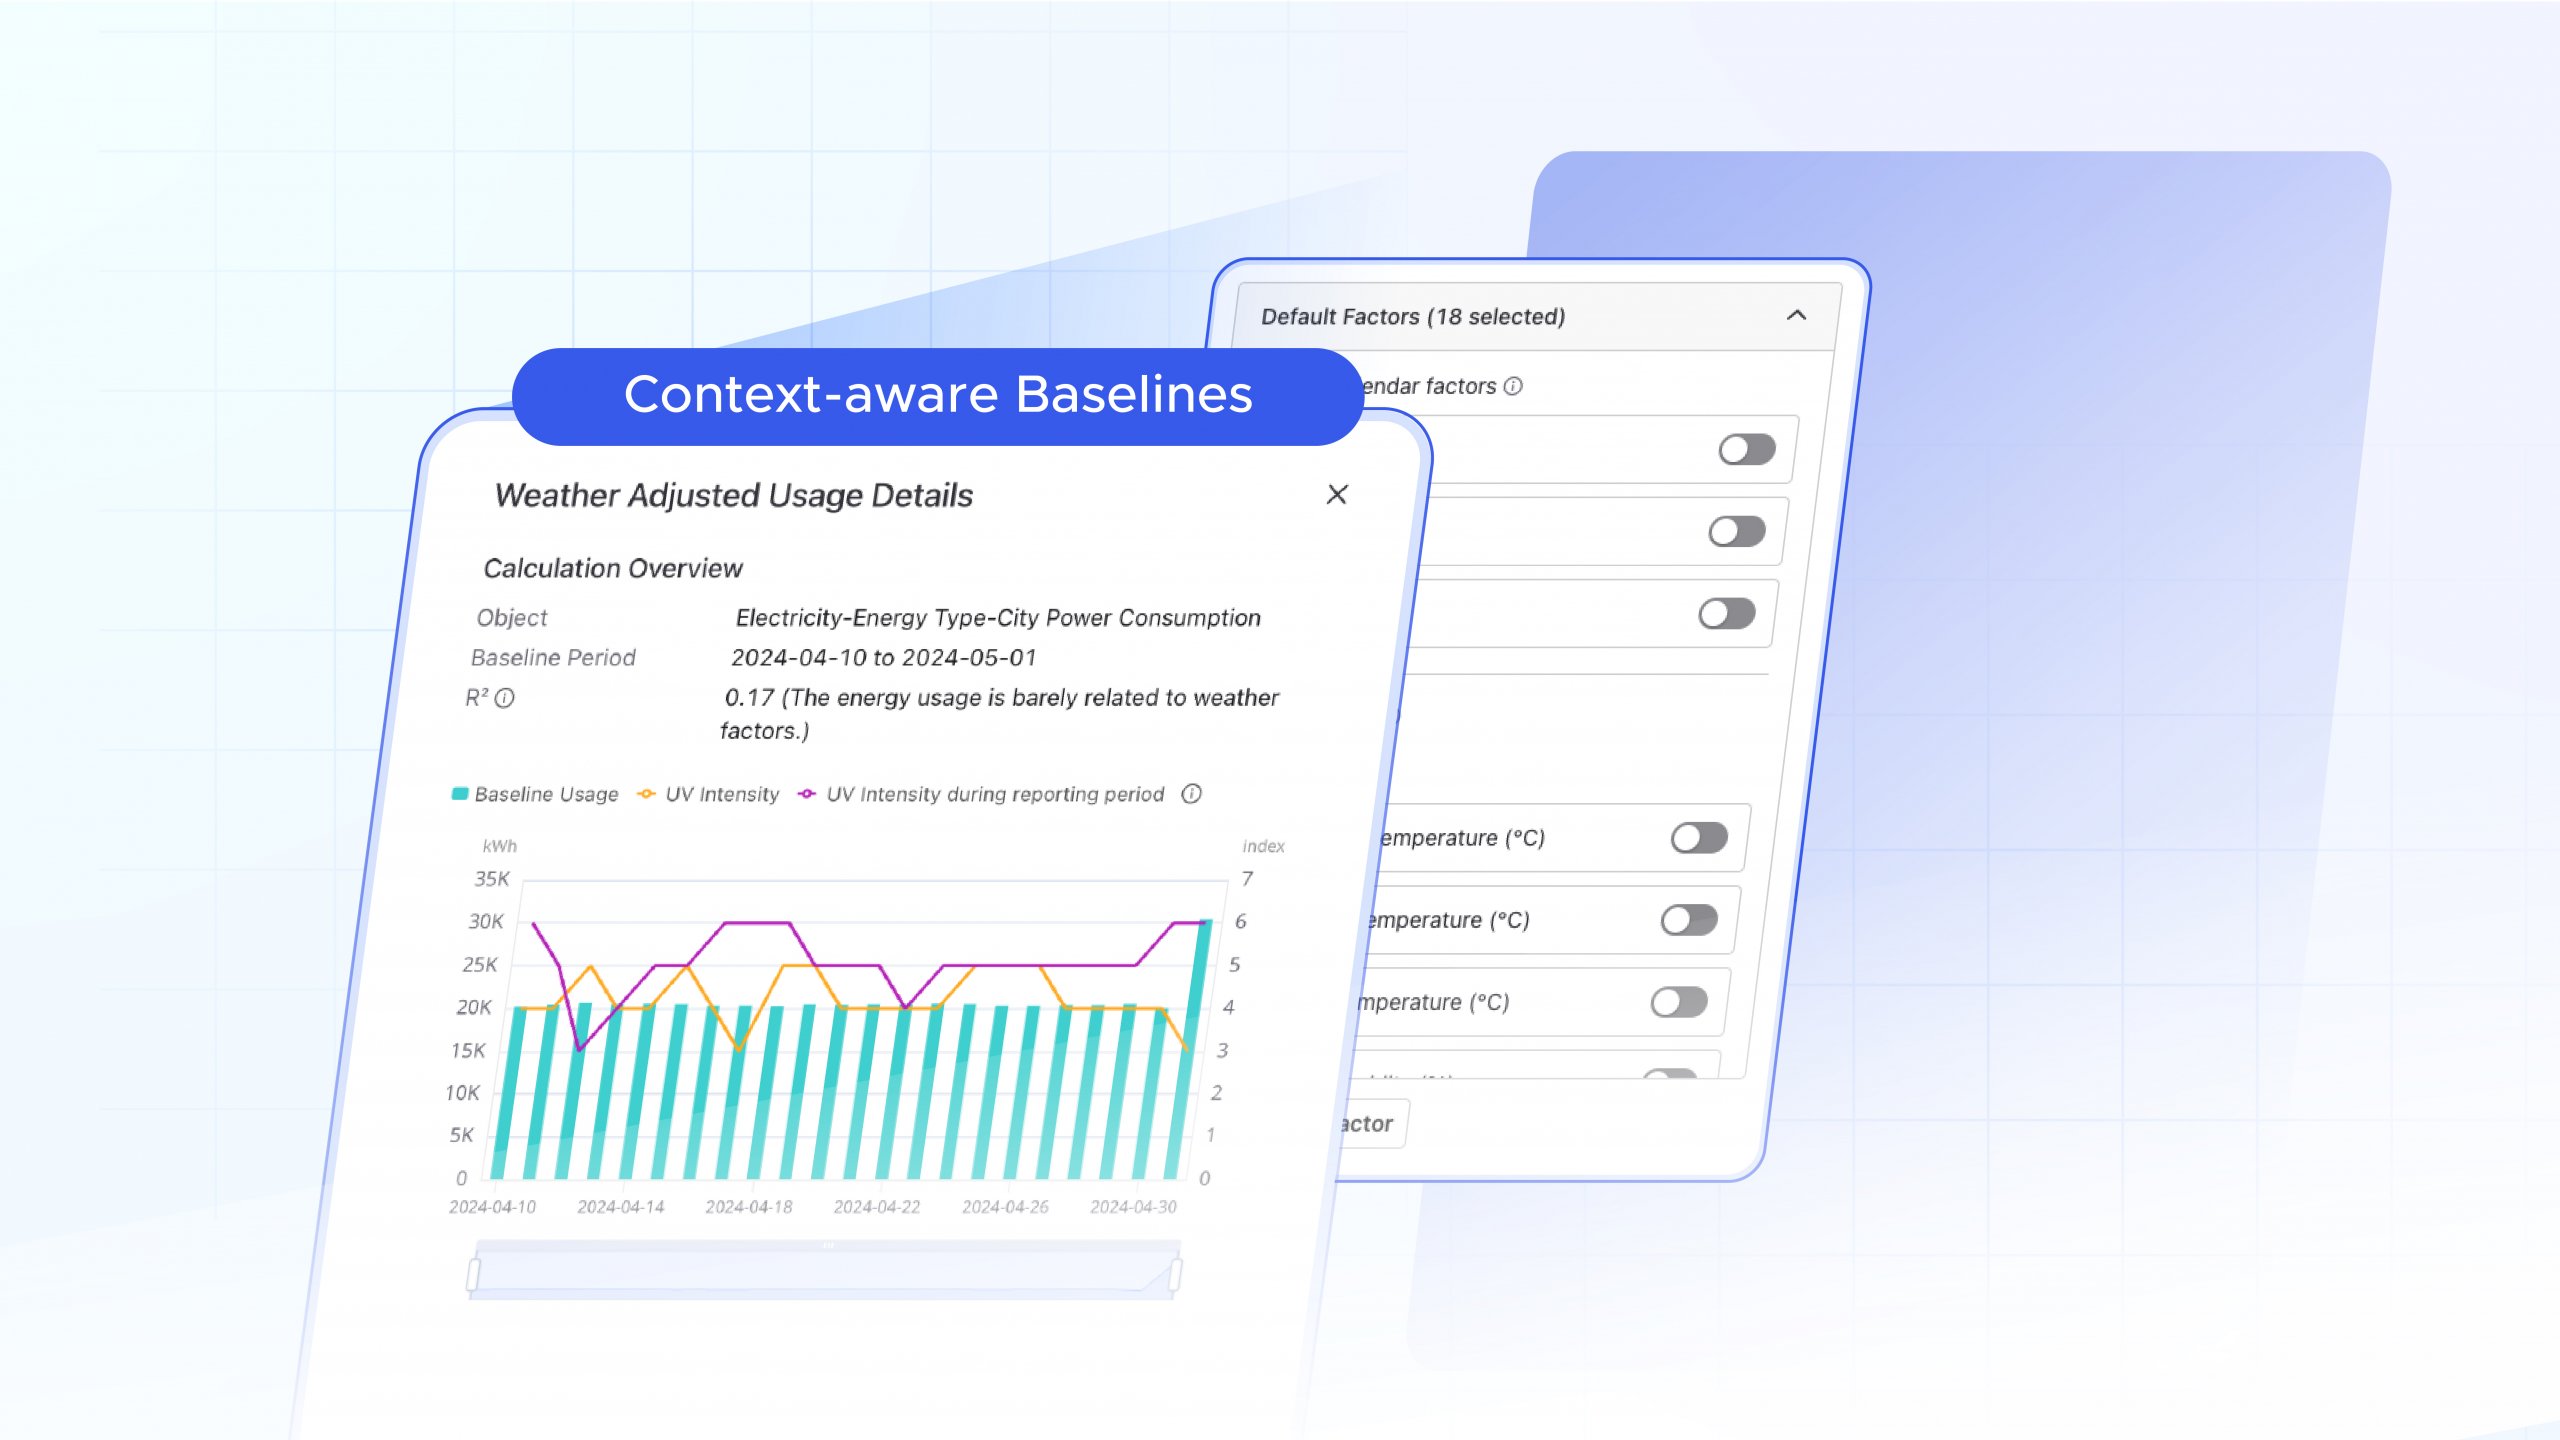
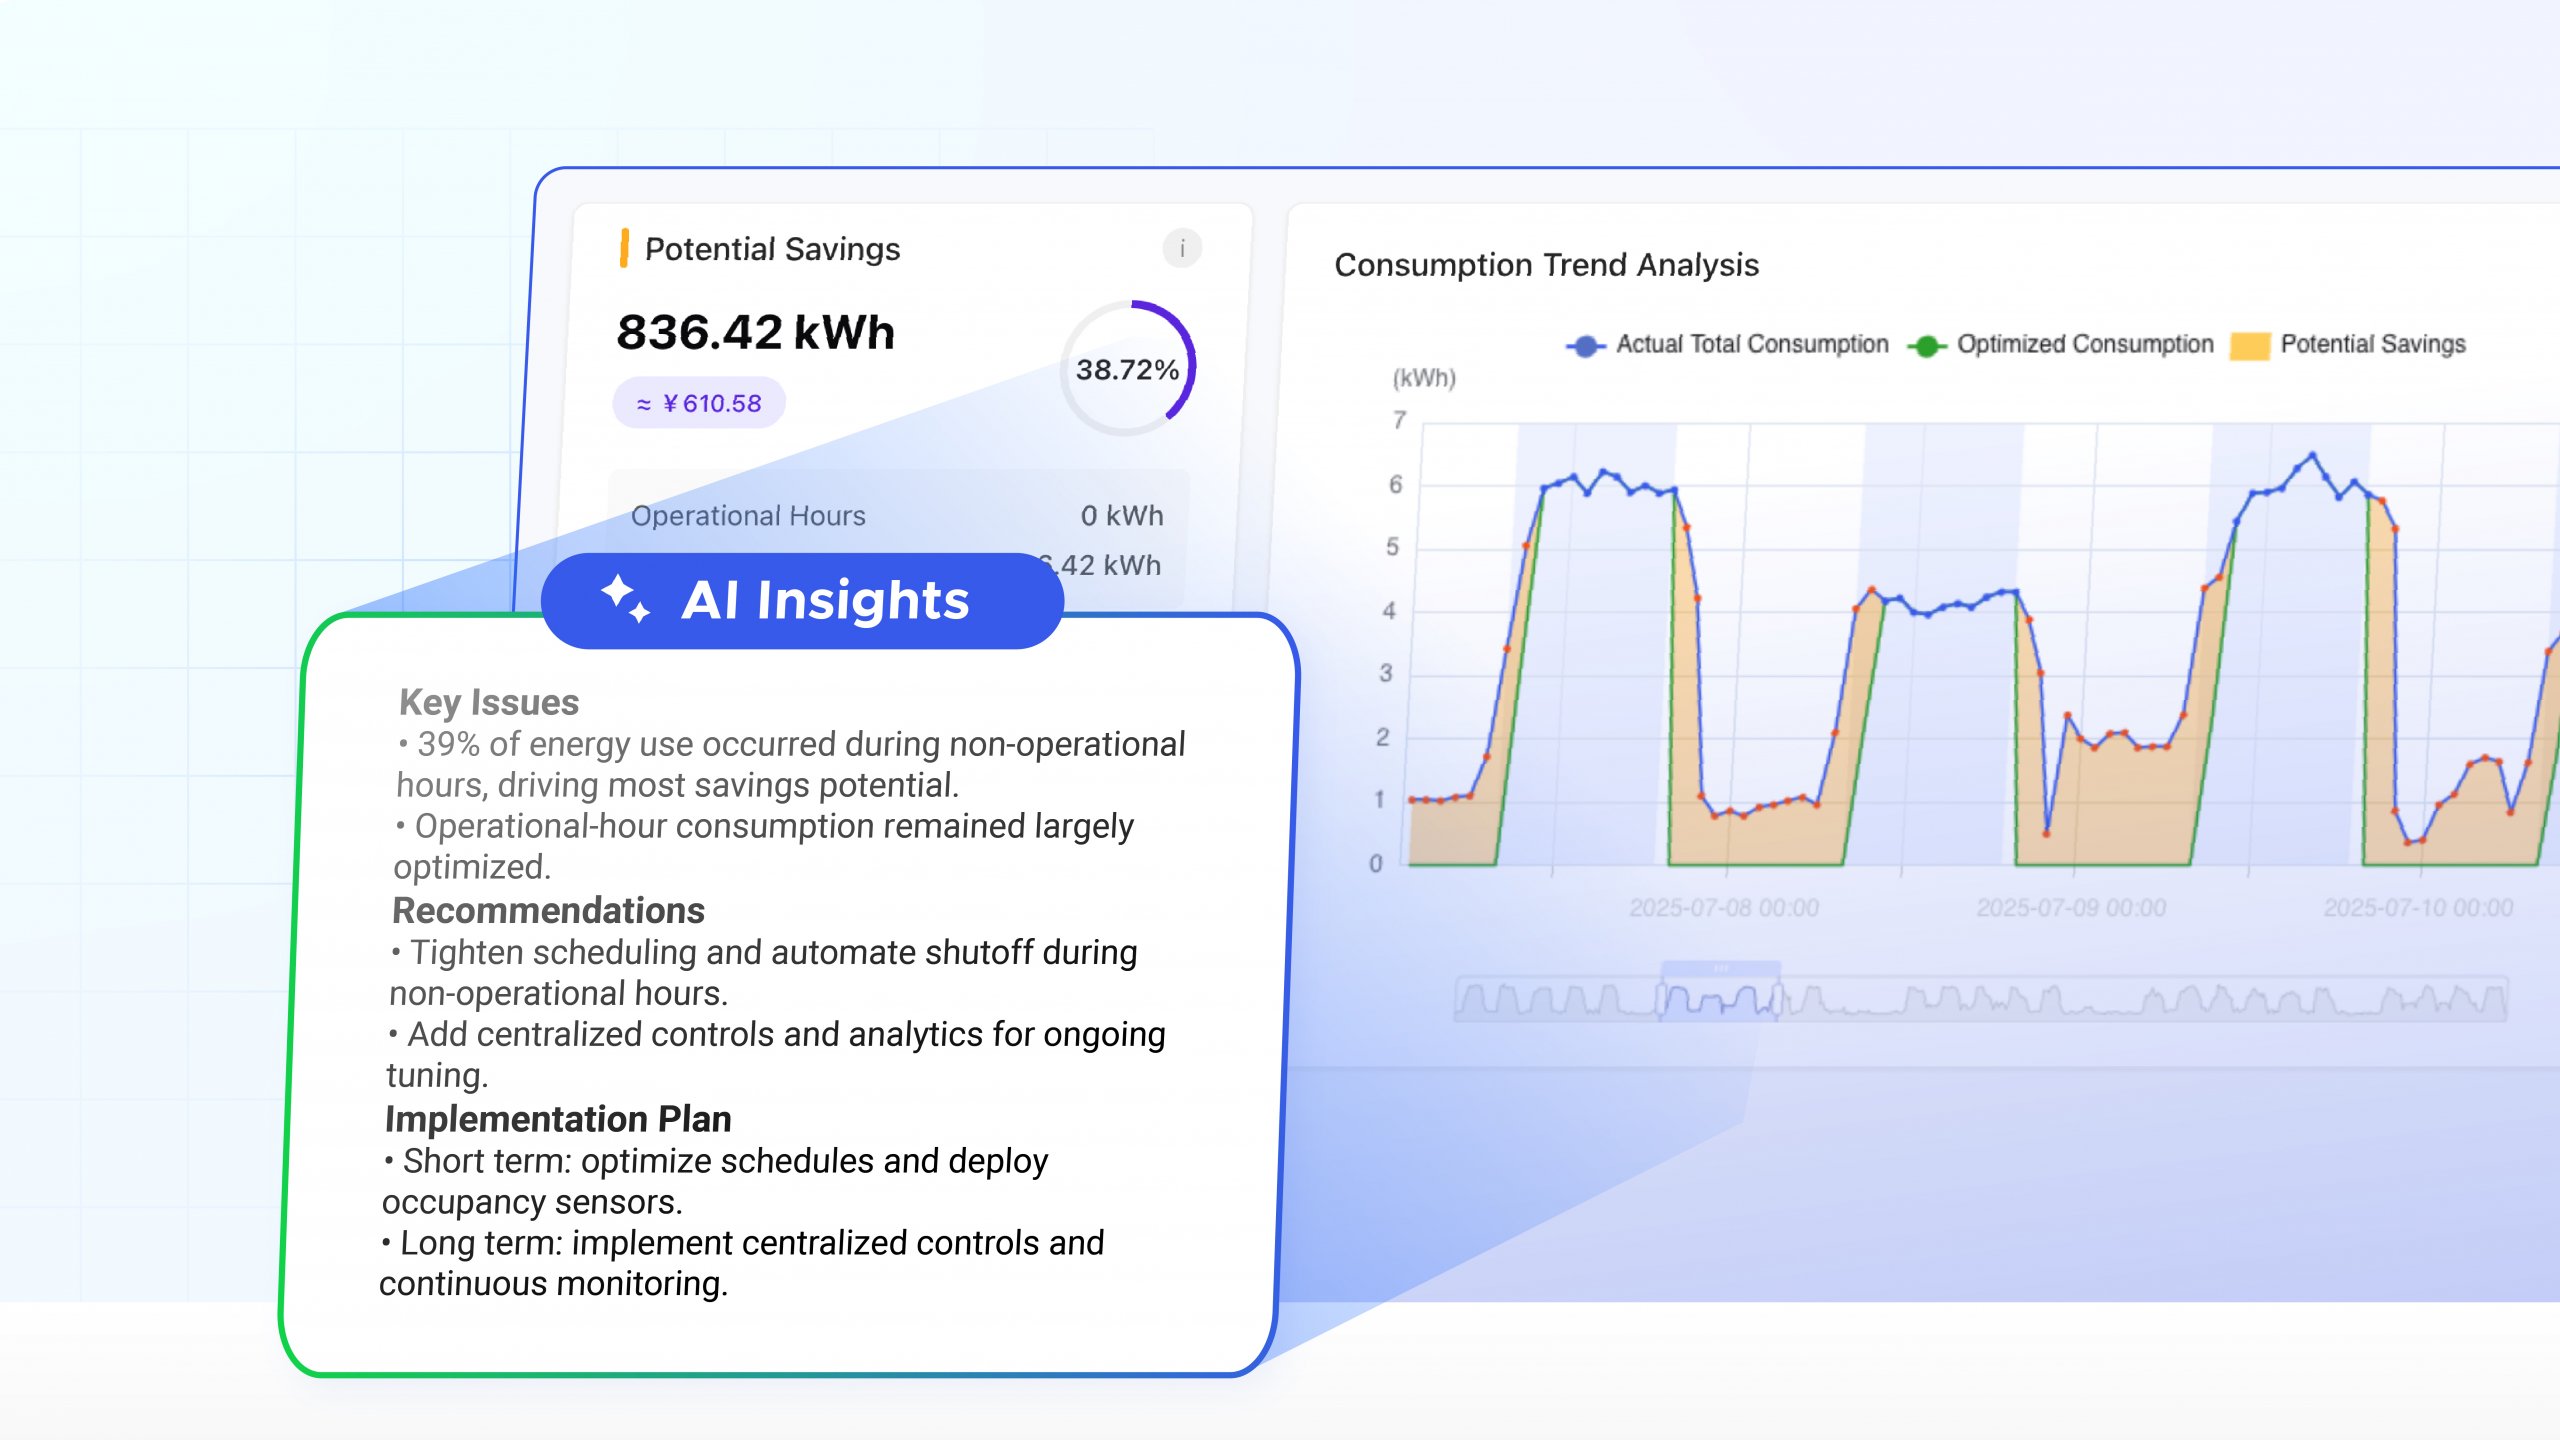
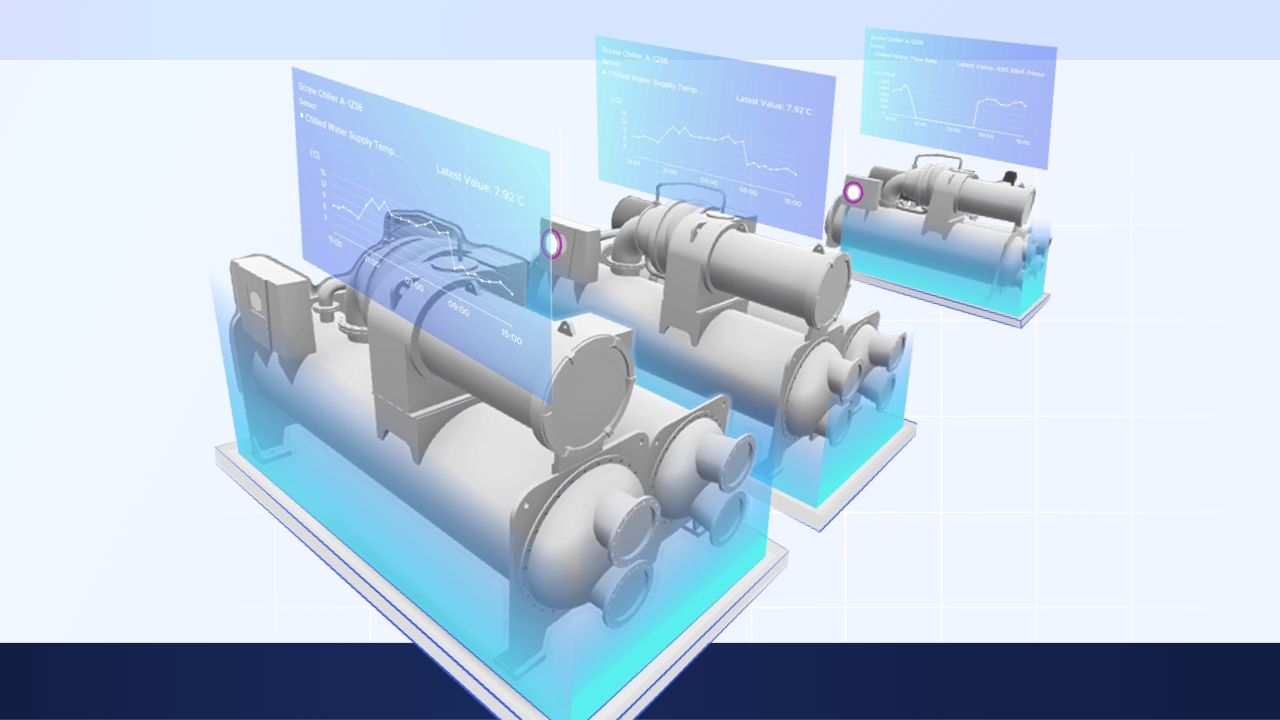
Energy baseline and efficiency tracking: Akila creates a fully transparent energy baseline and tracks the actual progress of an energy efficiency project, offering an equipment-level view of each energy-consuming asset. This provides granular, real-time data which allows automated tracking of costs inside the Akila platform.
Energy Pricing submodules: Not as technical as it sounds. In simple terms, Akila is set up to calculate and automatically adapt its calculations based on local pricing and regulations. So, if energy prices surge or drop for your facility in one city, this will be recorded and factored in without skewing the data from facilities in other locations.
Cross-border data standardization: As discussed in previous posts, portfolio managers have a notoriously difficult time standardizing their energy data, which tends to disappear into vast spreadsheets where errors and oversights multiply. Because Akila creates a single, standardized source of truth for data, and is already deployable across China and Southeast Asia, complex and rock-solid ROI calculations can be made in real-time, empowering stakeholders to make better decisions, faster.
Akila Dashboards: expanding the toolkit for transparency and benchmarking
Energy Finance is the newest entry in a fast-growing set of dashboards designed to give stakeholders deeper insight and control over the performance of their portfolios and net-zero roadmaps. Other dashboards include:
ESG Dashboard
Combining energy, water, GHG and waste reporting, in line with GRI frameworks for reporting, customizable to a client’s needs.
Asset Dashboard
Real-time, high-level KPI data for maintenance, in line with global standards for reporting
Energy Dashboard
Granular, equipment-level views of near-real-time energy use and efficiency gains, in line with IPMVP standard.