Key benefits:
- Capability for international and customized ESG management
- Reports with Global Reporting Initiative standard KPI Options for multiple frameworks
- Real-time analytics of ESG-related risks and trends
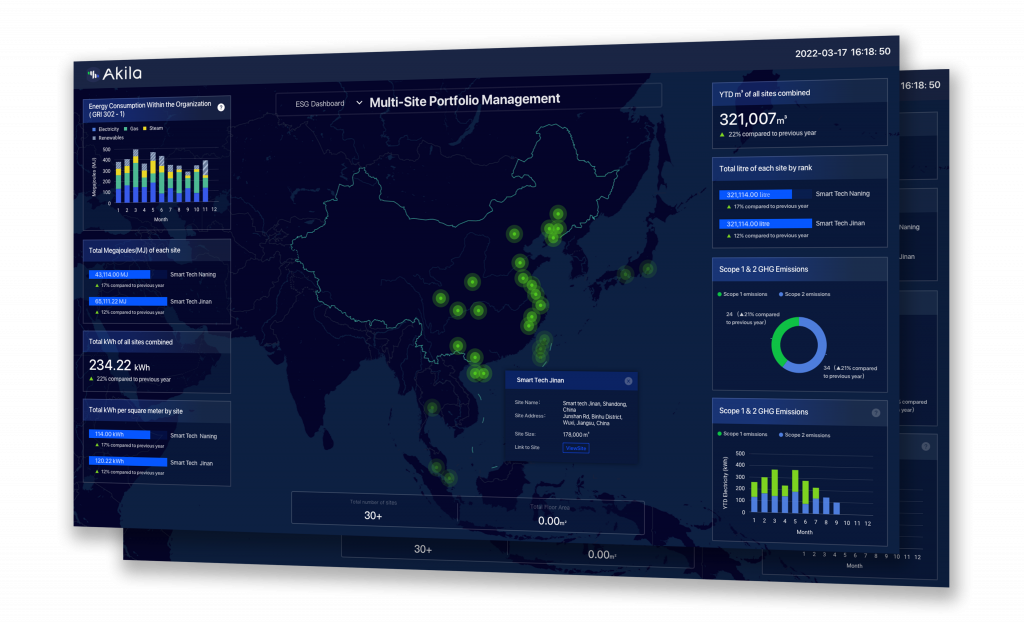
A sustainability cockpit for decision-makers and portfolio managers
There is no doubt that the ESG era is in full swing. However, as multinationals and portfolio-holders around the world rush to adopt ESG frameworks, many are encountering considerable practical challenges in achieving the systemic measurement of sustainability required by ESG, and achieving fast, responsive monitoring of the performance of their sites in critical areas like carbon and waste. This is precisely why Akila’s ESG dashboard was created, providing portfolio managers with a “sustainability cockpit” that allows global-level views of portfolio performance, real-time and actionable information about problems at their site, and the ability to zoom into detail on any asset in their portfolio down to the level of individual pieces of equipment.
Streamlined emissions calculations, viewed from anywhere
Global portfolio holders have to draw data on energy use and emissions from multiple sites, accurately and reliably. For example, a portfolio may include an office in Guangdong with on-site solar and a factory in Indonesia using coal-based power from the grid, meaning each will have a different CO2 equivalent emission from their energy use. Akila intelligently accounts for the local energy mix at each site and calculates CO2 emissions and energy usage based on local conditions and continuous sensor data, fed securely to the cloud using Azure IoT Edge and Hub.
Streamlining CO2-equivalent emissions and aligning them requires global infrastructure to be made usable—in March, Akila launched its Hong Kong-based ASEAN data center providing fast, secure and reliable access to Akila in full compliance with the data protection policies in both mainland China and Southeast Asian countries. All this adds up to a secure, globally accessible platform with real-time ESG data.
Transform annual reporting into action with ESG Analytics
Global portfolio holders are obliged to perform ESG reporting annually—but management is a daily and continuous process. Simply having the data isn’t as much of a problem as having it at the right time. The ESG Dashboard’s analytics empower users to tackle complex tasks and ambitious goals with proactive management.
For example, a site manager may have to reduce energy intensity and waste generation by 10% in a single year across a wide-ranging portfolio. This is no small task. Say a factory in Malaysia has failed to meet its energy efficiency goals. Energy intensity is too high—the problem can’t be the whole factory obviously. Digging deeper, the site’s assets can be examined in detail. Chillers, boilers, HVAC, compressors. Looking closely, a compressor leak has been causing an energy drain. By scheduling a work order from within the Asset module, the problem can be solved immediately.
The problem of waste management hasn’t been solved yet though. Powered by the Environment Module, ratios of solid waste recycling, carting, and incineration are all visible in the ESG Dashboard. Types and categories of waste are visible, showing recycling opportunities. Chemical byproducts from production processes—are they being disposed of when they could be turned into a useful product? Could they be resold as a precursor to another concern? Are they being disposed of in environmentally positive ways? Handling these metrics from inside the dashboard will help reduce waste generation and promote the circular economy.
Adaptive and customizable for meeting any framework
Global portfolios are always a complex management task. In the ESG era, wide-ranging concerns require focused, nuanced, and customizable solutions. If you have sites in mainland China and ASEAN and are listed on the Hang Seng Index and Korea Exchange, reporting becomes a complex task. The Akila ESG Dashboard offers a powerful solution—customizable, multi-dashboarding for sites.
Investors may be most interested in the climate sustainability of a particular site in Korea—with this in mind, the TCFD may be the most appropriate framework for reporting. Or perhaps a future listing in New York is the goal—in which case the SASB might be an appropriate framework instead of the GRI framework. ESG reporting frameworks serve different goals and have different priorities. In any case, Akila’s ESG Dashboard is customizable and can provide the appropriate KPIs in the relevant framework for use.
A roadmap for getting better and better
The digital transformation in business is driven by data—and maintaining a chain of verifiable, high-quality data is essential for business growth. Many businesses struggle to break down data silos and create actionable operational data and metrics. Without first overcoming these silos and creating a platform for acting on this data, businesses are left in the dark until it comes time to tabulate ESG data and report. Akila solves these problems and puts businesses on a road to data actionability and full ESG accountability.