Every AI deployment carries a carbon cost. Training and running models takes electricity, and electricity has a footprint wherever it’s generated. That cost is real, and it’s under increasing scrutiny from clients, regulators, and the public. But a footprint is only one side of the ledger. The question worth asking isn’t what AI costs. It’s what it returns.
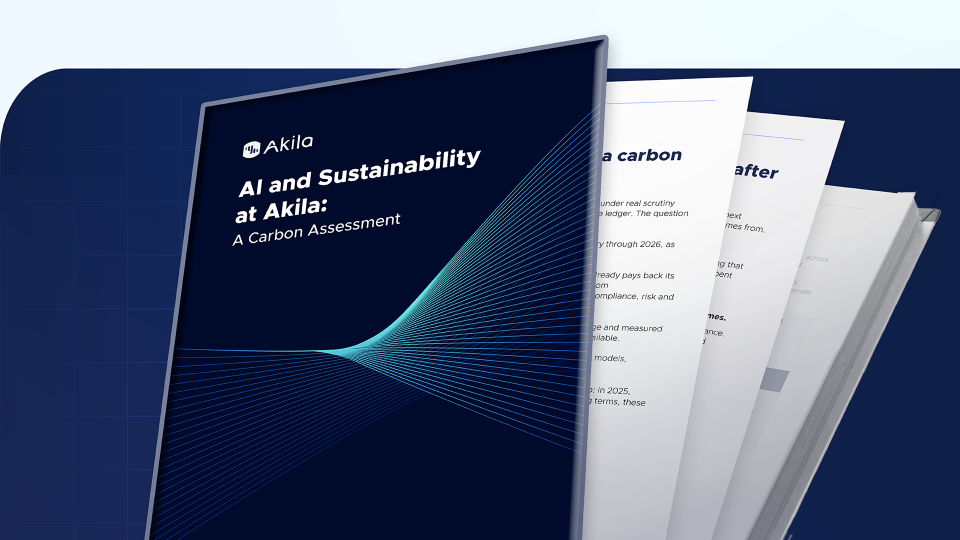
We set out to answer that question with actual data rather than assumptions. This post summarizes what we found. The full white paper, including methodology, can be found here.
Click here to download the whitepaper
The measurement, not the projection
Our first production AI at Akila does one job: optimize HVAC, the heating, ventilation, and cooling systems that dominate a building’s energy use. We measured its carbon return across seven clients and 32 sites in France, Singapore, and China, spanning chemical manufacturing, retail, logistics, healthtech, and commercial real estate.
The result held in every single deployment. The carbon saved by the AI’s optimization exceeded the carbon spent running it, in every case, on every site’s real grid.
- On the cleanest grid in our sample (France), the return was still 4x
- On the most carbon-intensive grid (China), it reached 121x
- Across the full weighted sample, the average was 69x
These aren’t modeled estimates. They’re built bottom-up from metered electricity usage, measured energy savings, and each location’s actual grid emissions factor, with published benchmarks used only where direct measurement wasn’t yet available. The full methodology, including data quality tiers for every input, is documented in the appendix of the white paper.
Where our AI footprint actually comes from
Understanding the payback requires understanding the cost side clearly too. In 2025, and continuing into 2026, our AI carbon footprint splits into four categories:
- Facilities optimization (51%, 13.3 tCO2e): Hardware deployed at client sites running the HVAC control that generates the payback above. This includes both electricity and amortized manufacturing emissions for the hardware itself.
- R&D AI tools (45%, 11.7 tCO2e): Agentic tools used internally to build the next generation of the platform. This is the largest single line item after deployed facilities AI, and it’s deliberate. We’re treating it as investment rather than overhead, de-risked by the return our first AI has already proven in the field.
- Platform AI insights (3%, 0.85 tCO2e): Already-deployed platform features, such as energy insights at the site and portfolio level, that accelerate identification of waste and cost reduction opportunities.
- Internal office use (under 1%, 0.03 tCO2e): Day-to-day productivity tools for non-development tasks. Negligible in scale, included for completeness.
The split matters. Roughly half of our current footprint is already paying back at multiples of its cost. The other half is a bounded, forward-looking bet on the same order of magnitude as the proven base, not dwarfing it.
What the next generation is built to do
Where 2025’s AI did one thing (save HVAC energy), the agents currently in development extend the same approach across building management more broadly. A selection of what’s in build:
- 3D digital-twin assistant: natural-language questions answered directly against a building’s live data and 3D model, already in production testing
- IFM site-risk agent: surfaces recurring equipment failures and inspection gaps before they escalate into costly repairs
- Territory benchmarking: combines portfolio data with public building databases to sharpen investment decisions
- Portfolio energy analysis: flags abnormal or inconsistent energy patterns across a client’s full portfolio
- Audit and due-diligence prep: centralizes unstructured records against the digital twin, cutting consulting and legal costs during transactions
- Refrigeration optimization: extends the machine learning approach proven on HVAC to a new system type
None of these returns have been measured at scale yet, and we’re not claiming otherwise. They’ll be held to the same standard as the HVAC AI: measured from live deployments once they reach client sites, not projected in advance.
Why the methodology matters as much as the number
A payback ratio is only as credible as the assumptions behind it. We built this model bottom-up wherever possible: metered token usage from Azure OpenAI logs, grid emissions factors from the Ember Global Electricity Review, energy-per-token figures from Epoch AI, cross-checked against other published sources. Every input is tagged by confidence, from T1 (measured or official data) down to T3 (internal proxy estimates), and the full workbook is available on request.
We measured our first AI’s return honestly, footprint included, using real grid data rather than convenient assumptions. We’re holding the next generation of agents to that same test.
Interested in other Akila whitepapers?
Check out our whitepaper on Future-ready Hotel Portfolios here.