Most buildings already generate huge amounts of energy and operational data. Electricity consumption, HVAC loads, occupancy levels, runtime hours, production activity and equipment behaviour are constantly being tracked.

The problem is not data scarcity. The problem is interpretation.

A rise in energy use can mean many different things. It may reflect higher occupancy, extended operating hours, increased production demand, hotter weather, changing usage patterns or equipment issues. A drop in consumption can also be misleading if the building is still underperforming relative to the conditions it operated under.

Without operational context, the same energy trend can point to very different conclusions.

Why Trend Lines Only Tell Part of the Story

Many teams still rely on simple comparisons to evaluate energy performance.

Did consumption go up or down? Did this month perform better than last month? Did energy use fall after an efficiency measure was introduced?

These comparisons are useful, but they rarely explain why consumption changed.

A building may implement an energy-saving initiative and still see electricity use rise afterwards. On paper, that can look like failure. But if occupancy also increased significantly during the same period, the building may actually be operating more efficiently than expected.

The opposite can happen too. A site may show lower consumption overall while still wasting more energy than it should under comparable operating conditions. The downward trend looks positive, but the underlying performance may still be drifting.

Historical averages rarely capture how buildings actually operate day to day.

Adding Context to Energy Performance

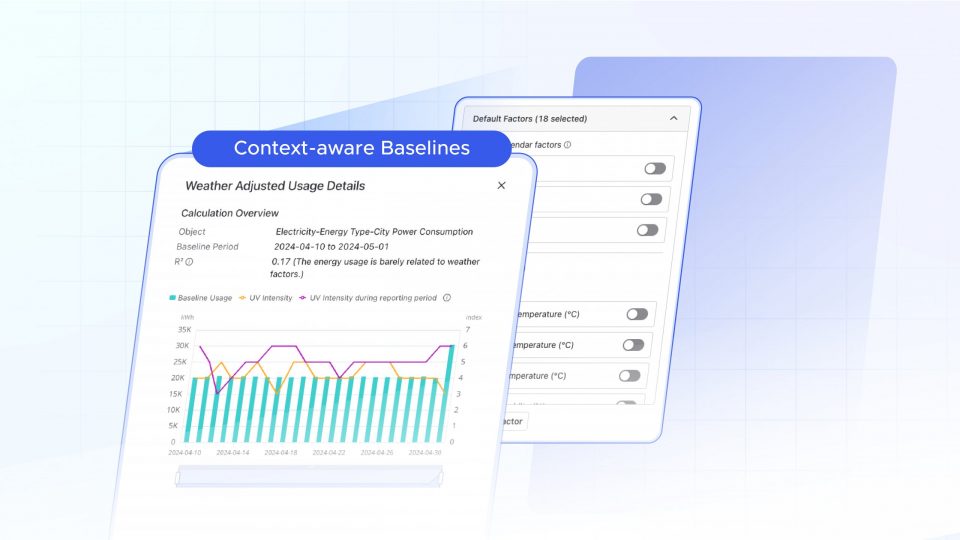
To understand whether a building is operating efficiently, energy consumption needs to be evaluated alongside the conditions surrounding it.

Akila connects energy consumption with the operational variables that shape it, including:

  • Weather and environmental conditions
  • Occupancy patterns
  • Operating hours
  • Production schedules and production load
  • Equipment runtime and behaviour
  • Site-specific operational data
  • Additional third-party or custom datasets

Each additional dataset makes the energy picture easier to interpret.

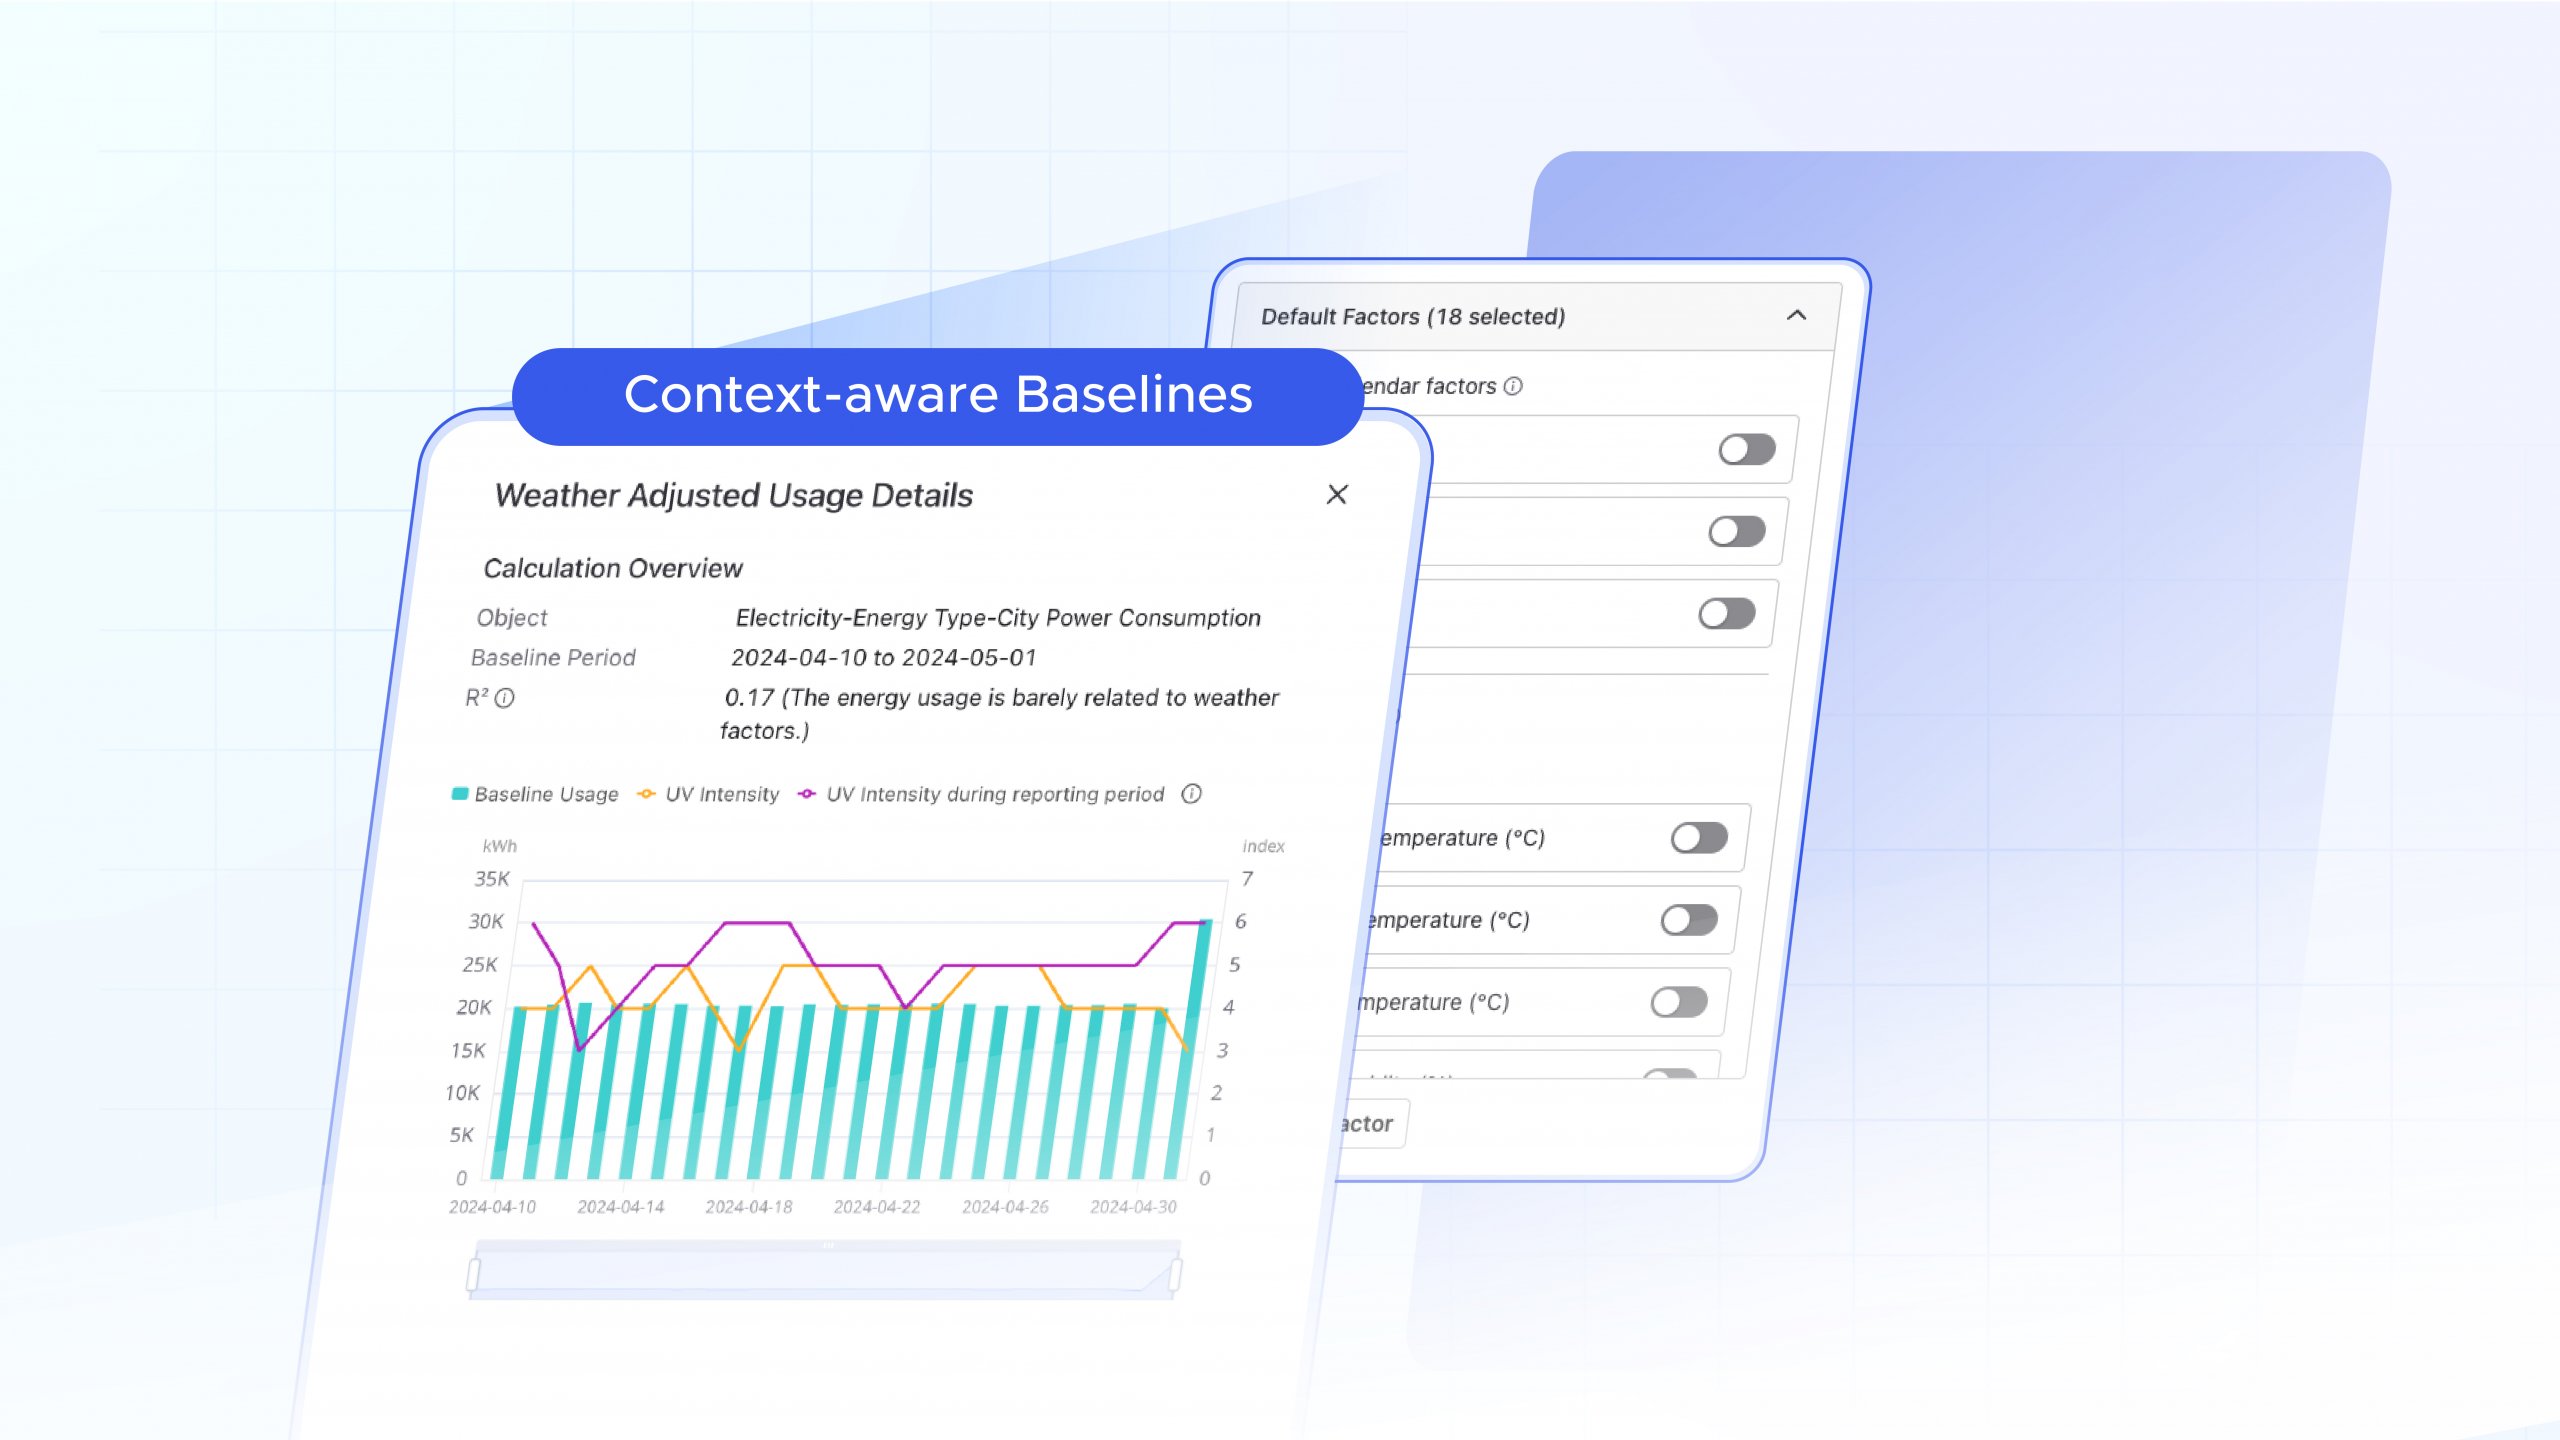
Instead of evaluating consumption in isolation, teams can compare actual performance against expected conditions based on how the building or facility was operating at that moment. That creates a much clearer view of what is happening across the site.

Teams can begin answering questions such as:

  • Was this increase expected?
  • Is the building becoming less efficient?
  • Did the energy-saving measure actually work?
  • Which operational factor is driving the change?
  • Is this a short-term fluctuation or an emerging issue?

These questions directly affect operational decisions around maintenance, scheduling and energy optimisation.

Finding the Root Cause Faster

Energy issues are often difficult to diagnose because multiple variables change at the same time.

A manufacturing facility may consume more electricity during a production surge. A commercial building may draw more cooling energy during unusually hot weather. A mixed-use site may experience shifting demand patterns as occupancy changes throughout the day.

Without context, these situations can easily be misread. By comparing actual consumption against expected conditions, teams can spot when energy behaviour falls outside normal operating patterns and investigate the likely causes faster.

This also makes it easier to validate whether energy-saving initiatives are producing measurable results.

For example, an efficiency project may not immediately reduce total consumption if occupancy or production demand also increased during the same period. Comparing energy use against expected operating conditions can help teams identify whether the intervention still delivered measurable savings relative to the activity level of the building.

Moving Beyond Monthly Reporting

Many organisations still review energy performance through monthly reports and utility bill analysis. By the time an issue appears clearly, the inefficiency may have already been affecting operations for weeks or months.

With the right operational context, energy data becomes more useful for day-to-day decision-making. Teams can identify abnormal consumption patterns earlier, investigate deviations faster and focus attention where performance is starting to drift.

Akila supports this approach by helping operators:

  • Compare actual versus expected energy behaviour
  • Detect abnormal consumption patterns
  • Investigate root causes faster
  • Validate the impact of efficiency measures
  • Simulate operational scenarios
  • Prioritise areas requiring action

The result is a more practical approach to energy management grounded in how facilities actually operate.

A Clearer Picture of Building Performance

Energy consumption alone rarely tells the full story.

The same spike on a chart can represent operational growth, changing occupancy, seasonal weather patterns, equipment problems or genuine inefficiency depending on the surrounding conditions.

That is why operational context matters. By connecting energy data with the variables that influence it, teams gain a clearer understanding of what changed, why it changed and whether action is required.
Related Articles
The Energy Waste Most Buildings Never Notice

The Energy Waste Most Buildings Never Notice

From Reactive to Condition-based Maintenance

From Reactive to Condition-based Maintenance

Scaling Intelligent, Low-Carbon Manufacturing with Merck Life Science

Scaling Intelligent, Low-Carbon Manufacturing with Merck Life Science

Take the next step with Akila

If you want better from your buildings, our team is here to help. Let’s set up a call to discuss your needs and show you how Akila works, from deploying digital infrastructure to optimization.

910-Product-page
Secondary ~ Request Demo Simple

When people think about energy inefficiency in buildings, they usually picture aging equipment, poor insulation, or inefficient HVAC systems.

But a surprising amount of waste comes from something much simpler: Systems operating when nobody needs them. Lights left on overnight. HVAC serving empty zones. Equipment continuing to run long after occupants have gone home. Across a single building, these issues can seem minor. Across an entire portfolio, they quietly become a significant operational and financial burden.

The problem is that most organizations don’t actually lack energy data. They lack visibility into operational context.

A dashboard might show rising consumption overnight, but that doesn’t immediately answer the important questions: Was the building occupied? Was this expected? Which systems were responsible? Was the increase operationally necessary or simply overlooked?

Without context, energy data becomes difficult to act on.

Why After-Hours Consumption Is So Difficult to Manage

Modern buildings generate enormous amounts of operational data. Meters, BMS platforms, IoT devices, and utility systems continuously collect information across lighting, HVAC, plug loads, and equipment.

Yet many facility and operations teams still rely on manual review processes to identify inefficiencies.

That creates several challenges. First, after-hours inefficiencies are often gradual rather than dramatic. A single AHU running longer than necessary may not trigger alarms. Lighting left active in low-traffic areas may go unnoticed for months. Individually, these issues appear small. Together, they create persistent energy waste. Second, operational exceptions are common. Cleaning crews, late-night production shifts, maintenance activities, and special events all create legitimate reasons for buildings to consume energy outside standard schedules. That makes it difficult to distinguish between acceptable usage and avoidable waste. Third, portfolio scale changes everything.

An issue that seems insignificant in one building becomes expensive when repeated across dozens or hundreds of sites. Many organizations simply do not have the resources to manually investigate every irregular energy pattern across their portfolios.

As a result, inefficiencies remain hidden in plain sight.

The Operational Impact Beyond Energy Costs

The financial impact of unnecessary energy consumption is already significant, especially as utility prices continue to fluctuate globally. But the consequences extend beyond electricity bills.

Persistent after-hours operation can increase equipment runtime unnecessarily, accelerating wear on HVAC systems, lighting infrastructure, and other assets. Longer runtimes often translate into higher maintenance requirements and shorter equipment lifecycles.

There is also a sustainability impact. Many organizations now operate under internal ESG targets, carbon reduction commitments, or regulatory reporting requirements. Unnecessary energy consumption directly affects emissions performance and can undermine broader sustainability initiatives.

Perhaps most importantly, unnoticed inefficiencies create operational blind spots.

If teams do not clearly understand when buildings are consuming energy and why, optimization becomes reactive rather than strategic.

Expanding Akila’s AI Insights Reports

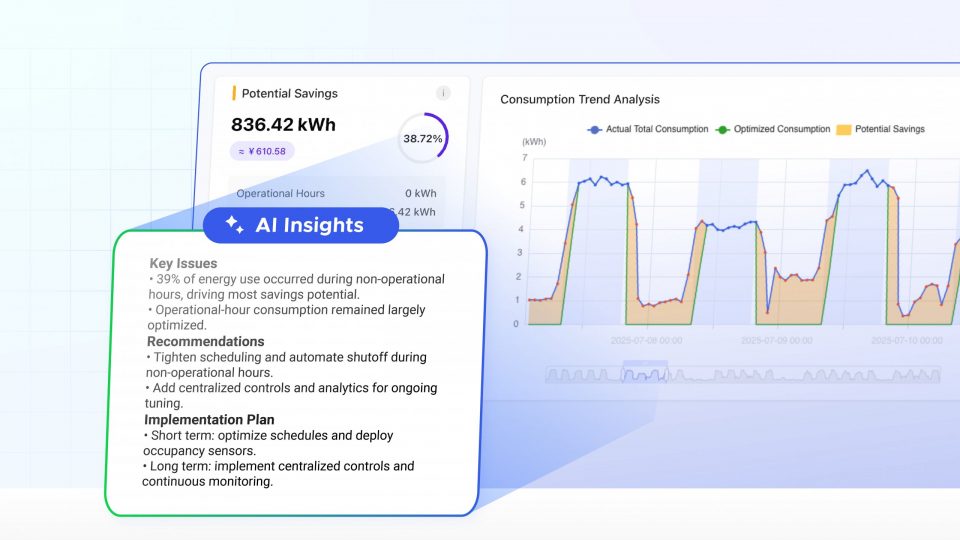
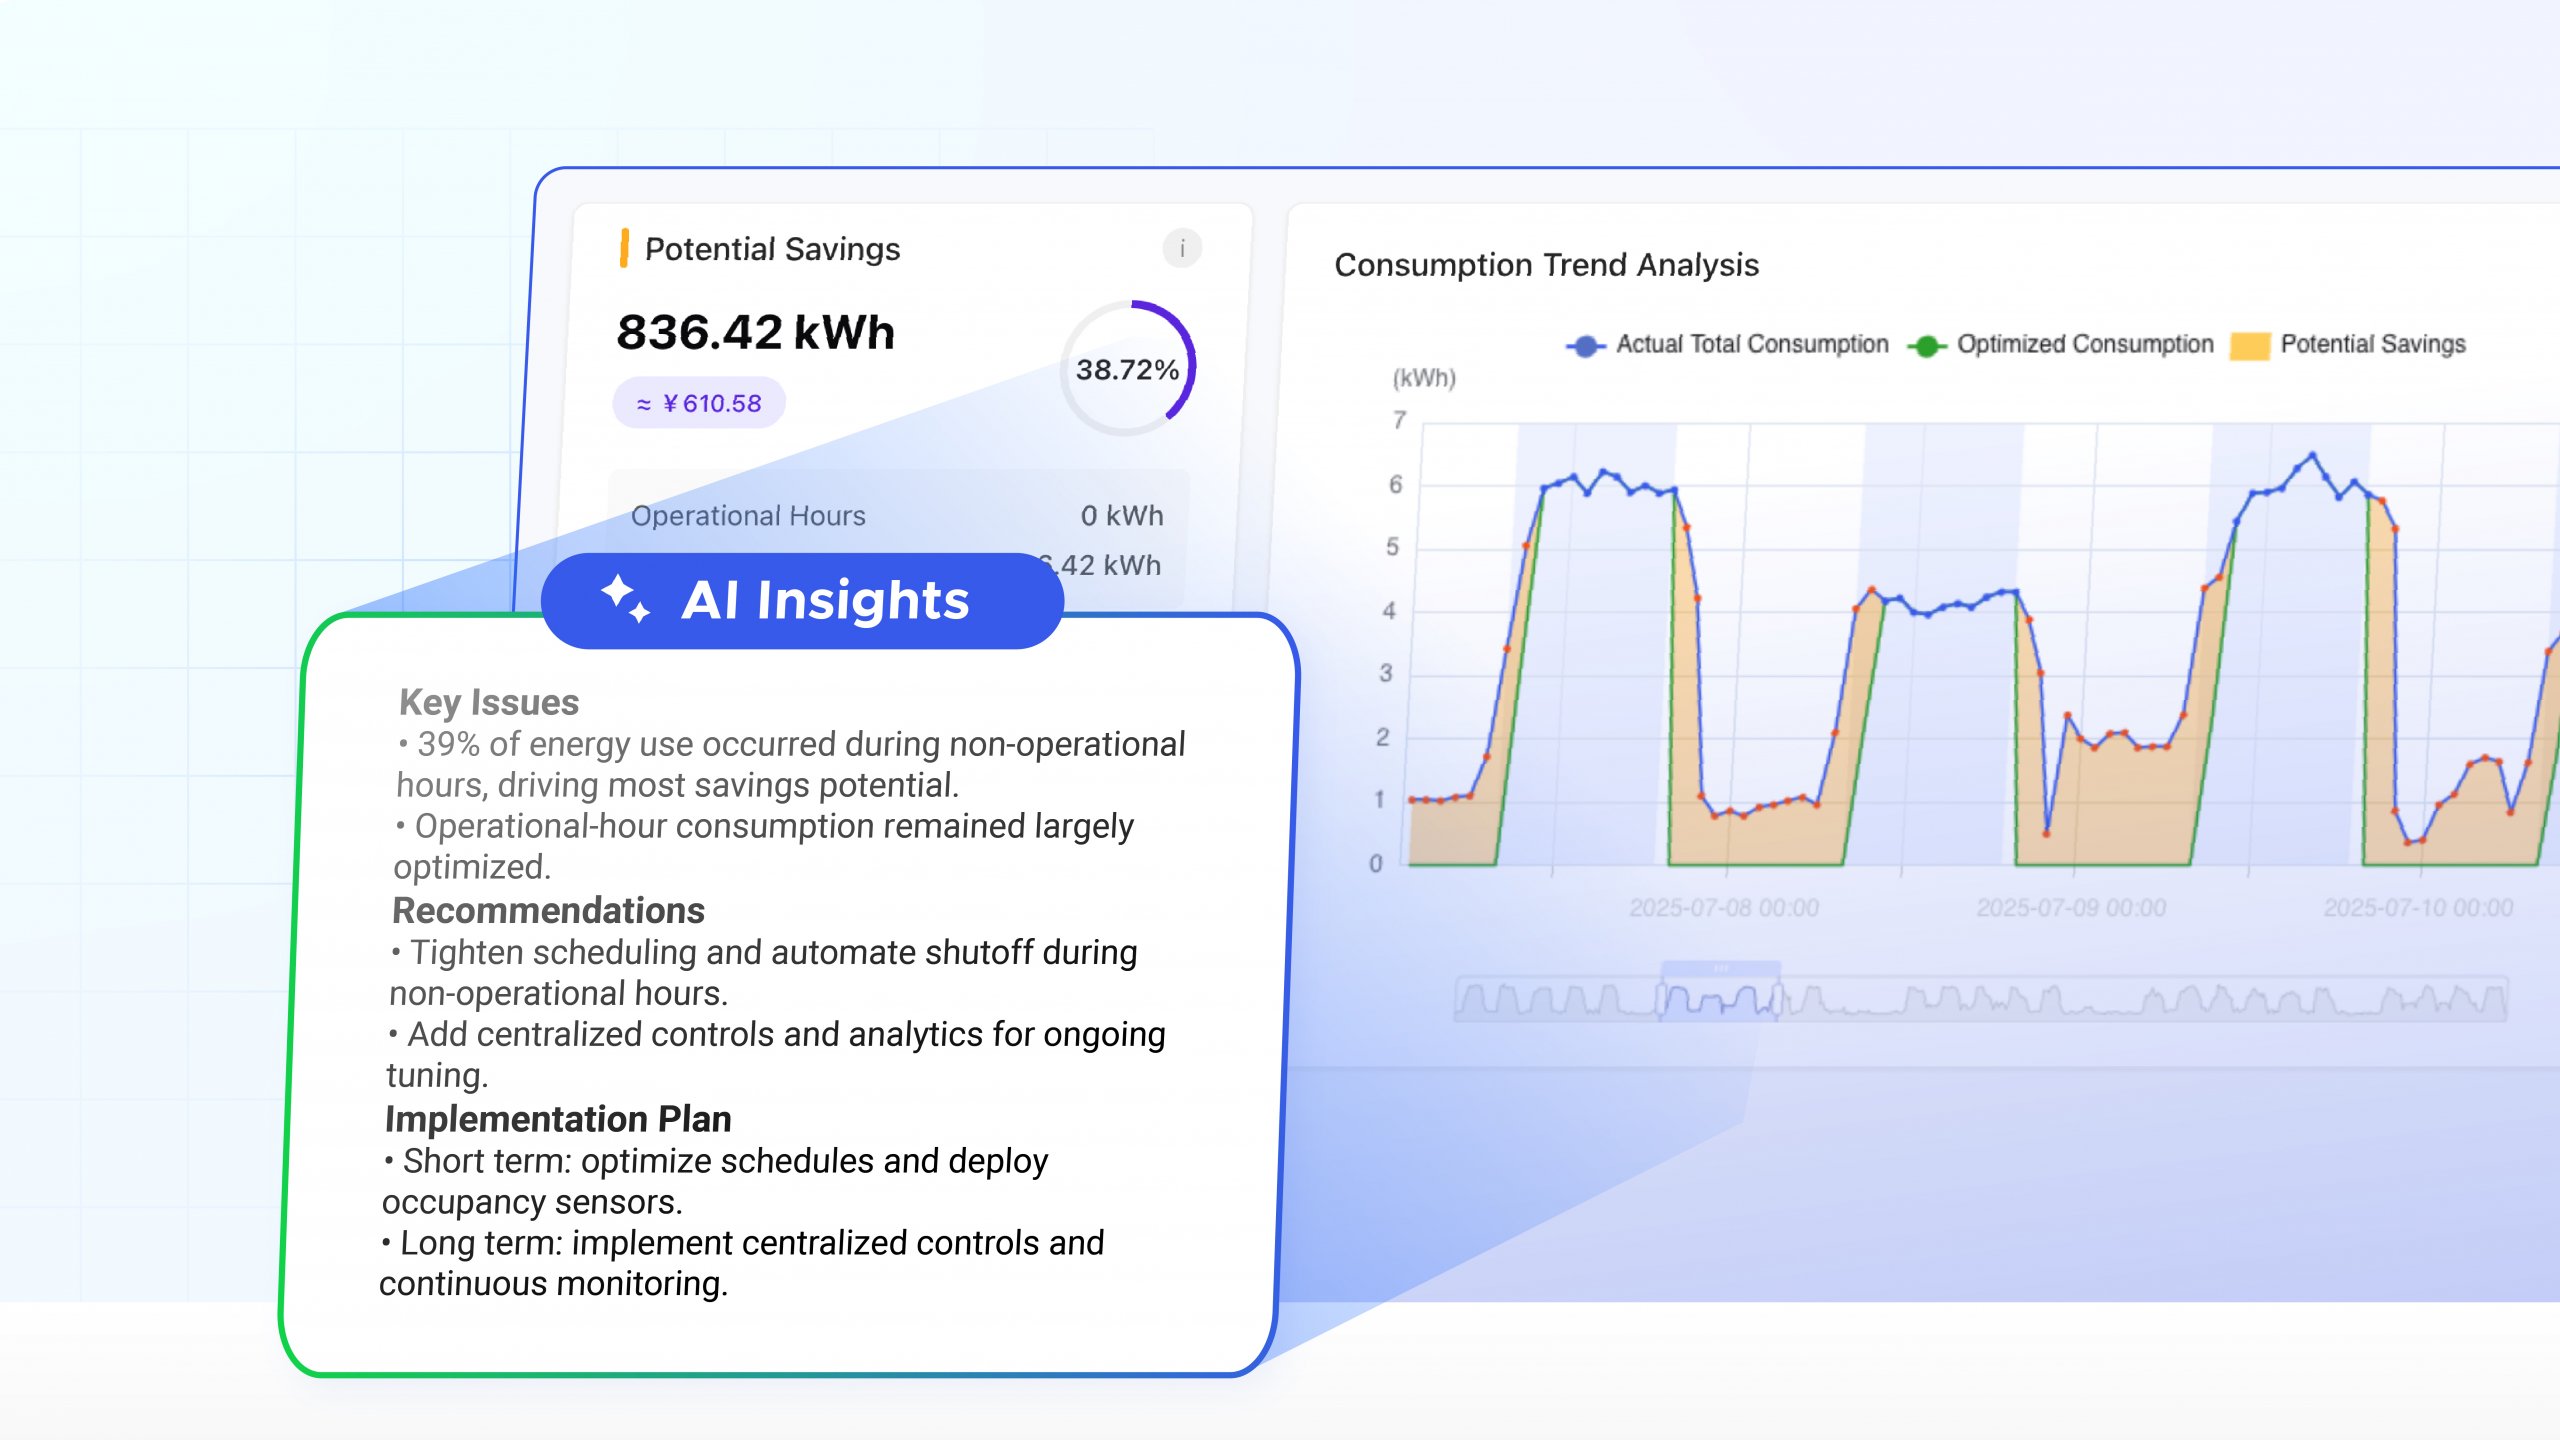
To address this challenge, Akila has introduced a new capability within its AI Insights Reports feature focused on operational versus non-operational energy consumption. The feature analyzes energy usage patterns across building systems such as lighting, HVAC, and connected equipment, then compares consumption behavior against defined operational schedules.

The goal is straightforward: Help teams quickly understand what is happening outside operating hours and determine whether it is justified.

The system identifies:

  • Energy consumption during non-operational hours
  • Abnormal usage patterns
  • Systems operating beyond expected schedules
  • Potential areas for optimization

Alongside visual energy trends and operational-hour breakdowns, the platform also generates AI-based written analysis that summarizes findings, highlights areas of concern, and recommends potential next steps.

Rather than requiring teams to manually interpret raw data, the feature helps convert consumption patterns into operational insight.

Turning Data Into Action

One of the biggest challenges in energy management is not identifying that waste exists. It is understanding where to start. A building may have thousands of data points and dozens of integrated systems, but operations teams still need practical guidance.

That is where contextual analysis becomes valuable.

Instead of simply flagging elevated overnight consumption, Akila’s AI Insights Reports can suggest operational adjustments such as:

  • Revising schedules
  • Introducing occupancy-based controls
  • Investigating zones with persistent after-hours activity
  • Improving shutdown procedures
  • Deploying additional metering or controls where visibility is limited

The intent is not to replace facility teams or automate decision-making blindly, but to help teams prioritize attention faster and make operational reviews more scalable across large portfolios.

Visibility Before Optimization

Not all after-hours energy consumption is waste. Hospitals, factories, logistics hubs, laboratories, hotels, and many other facilities operate beyond traditional business hours. Even office environments frequently have exceptions tied to cleaning, maintenance, or overtime work.

That is why visibility matters more than assumptions. Effective optimization starts with understanding what is happening, where it is happening, and whether it aligns with operational intent.

For many organizations, that level of awareness has historically been difficult to achieve consistently across large building portfolios. By combining operational context, energy analytics, and AI-generated interpretation, Akila helps make those hidden patterns easier to see and easier to act on.

Sometimes the biggest opportunities are not hidden in major capital upgrades. Sometimes they are simply the systems still running after everyone has gone home.

Related Articles
Energy Data Needs Context

Energy Data Needs Context

From Reactive to Condition-based Maintenance

From Reactive to Condition-based Maintenance

Scaling Intelligent, Low-Carbon Manufacturing with Merck Life Science

Scaling Intelligent, Low-Carbon Manufacturing with Merck Life Science

Take the next step with Akila

If you want better from your buildings, our team is here to help. Let’s set up a call to discuss your needs and show you how Akila works, from deploying digital infrastructure to optimization.

910-Product-page
Secondary ~ Request Demo Simple

From Reactive to Condition-based Maintenance

May 7, 2026

Most maintenance strategies still sit somewhere between two familiar extremes: fix things when they break, or service them on a fixed schedule.

Both approaches have been standard for decades. Neither reflects how modern buildings and equipment actually operate. As buildings become more instrumented and data-rich, those gaps are harder to ignore.

This gap is where condition-based maintenance comes in.

The limits of reactive maintenance

Reactive maintenance is straightforward in theory. Something fails, you fix it. In practice, it creates a predictable set of problems.

Downtime is unplanned and often disruptive. Repairs are rushed, which increases cost and reduces control over outcomes. Teams spend more time responding to incidents than preventing them. It concentrates effort in the wrong places. Critical assets may not be monitored closely enough, while lower priority issues still turn into urgent work because they escalate too far.

The result is a team that stays under pressure, with little sense of what’s coming next.

The shortcomings of scheduled maintenance

Scheduled maintenance was meant to make things more predictable. Regular intervals, predefined tasks, and repeatable workflows. It works in stable, low-variability environments. Modern building systems are not that.

Usage patterns change. Loads fluctuate. Equipment ages unevenly. Two identical assets in the same building can behave very differently depending on how they are used. Fixed schedules ignore that variation.

Some equipment gets serviced before it needs attention. Other equipment fails between inspections. Over time, this creates inefficiency in both cost and performance without improving reliability.

A shift in how maintenance is triggered

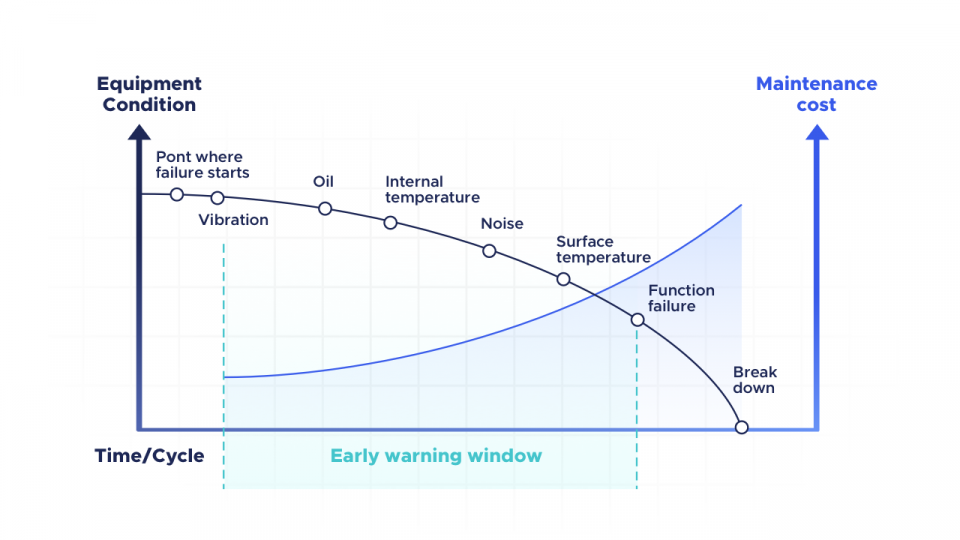
Condition-based maintenance starts from a different assumption. Maintenance should follow the actual condition of the equipment. In connected buildings, that condition can be measured continuously.

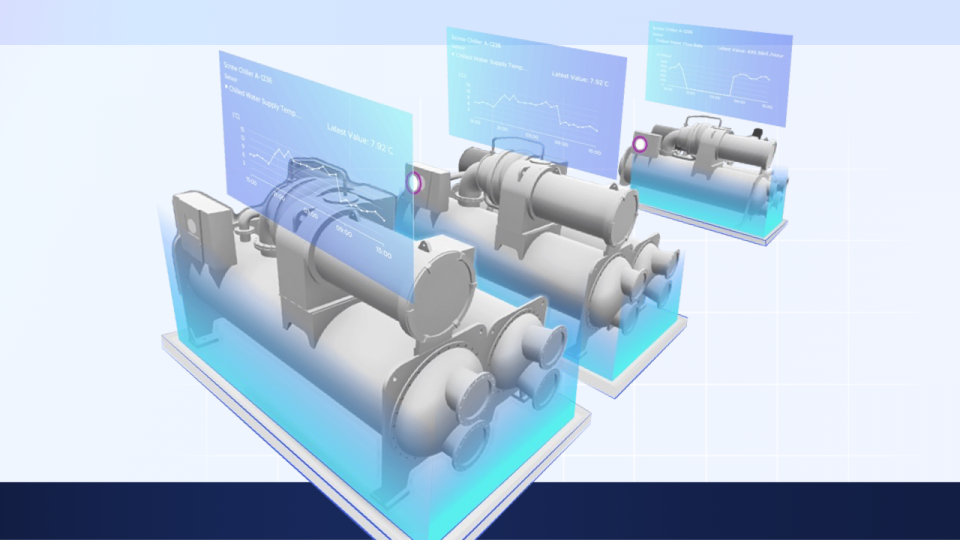
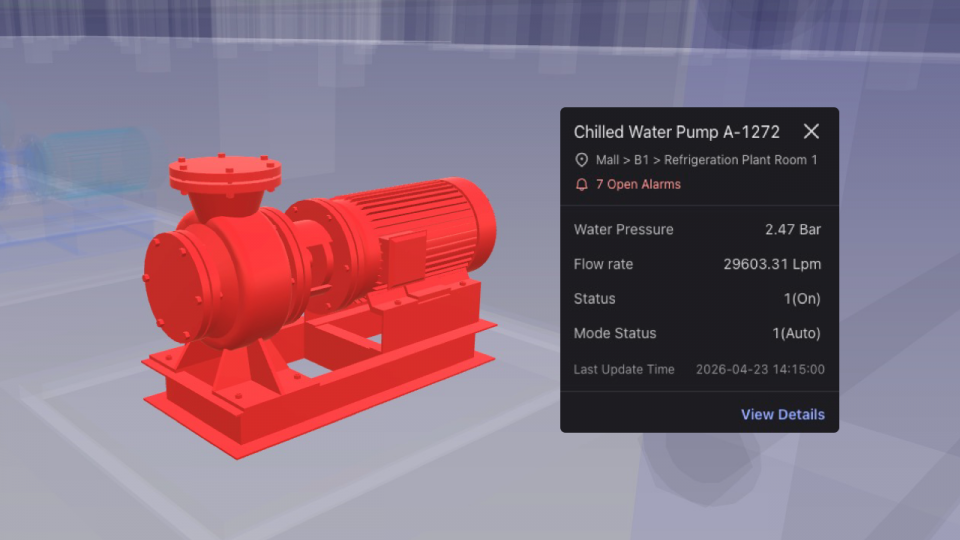
At Akila, this comes from integrating live data across building systems, including BMS, IoT sensors, and equipment controllers. The system flags changes in operating conditions that point to wear, inefficiency, or early faults. Instead of waiting for a failure or a scheduled check, maintenance is triggered when the data shows it is needed.

This shifts how maintenance is planned. Less time is spent forecasting schedules, more time responding to real operating signals.

What this looks like in practice

Condition-based maintenance only works if signals lead to action. That means moving beyond raw sensor data into workflows that maintenance teams can use day to day.

In a connected system, this includes:

  • Continuous monitoring of vibration, temperature, runtime, and energy use
  • Asset-specific thresholds based on equipment type, usage, and history
  • Automatic generation of work orders when conditions move outside expected ranges
  • Direct assignment of tasks into maintenance workflows

The key shift is turning data into work orders. Maintenance teams are no longer reacting to isolated alerts. They are working from a clear view of how assets are performing across the building or portfolio.

The operational impact

When maintenance follows actual conditions, the impact is clear.

Response times improve. Issues are picked up earlier, before they turn into failures that require urgent intervention. Unplanned downtime decreases. Equipment is serviced based on early signals rather than after breakdowns. Maintenance effort becomes more efficient. Work is focused on assets that need attention, which reduces unnecessary interventions and extends equipment life.

Across deployments, teams typically see:

  • Around 40% faster incident response
  • About 40% reduction in unplanned downtime
  • Up to 20% longer asset lifespan
  • Around 20% reduction in maintenance costs

The exact numbers vary by portfolio, but the direction is consistent.

Why this matters now

Most buildings already have the data. The challenge is making that data usable in day-to-day maintenance operations.

Without a connected view of assets and systems, data stays fragmented across platforms and teams. Maintenance decisions remain manual, even when the signals are available. Condition-based maintenance depends on connecting those signals so teams can interpret them, prioritize work, and act.

How this fits into Akila

The Akila platform brings building systems, equipment data, and operational signals into one place. This allows teams to move away from fixed schedules and toward maintenance driven by actual equipment behavior.

In practice, maintenance no longer revolves around isolated alerts or periodic checks. It follows a continuous view of how assets are performing across time and usage.

Closing thoughts

Maintenance is often treated as a cost center. It’s also a clear signal of how well a building is understood and operated. As buildings become more connected, the focus shifts to acting on the data in a precise and timely way.

Condition-based maintenance is a practical place to start.

Related Articles
Energy Data Needs Context

Energy Data Needs Context

The Energy Waste Most Buildings Never Notice

The Energy Waste Most Buildings Never Notice

Scaling Intelligent, Low-Carbon Manufacturing with Merck Life Science

Scaling Intelligent, Low-Carbon Manufacturing with Merck Life Science

Take the next step with Akila

If you want better from your buildings, our team is here to help. Let’s set up a call to discuss your needs and show you how Akila works, from deploying digital infrastructure to optimization.

910-Product-page
Secondary ~ Request Demo Simple

Scaling Intelligent, Low-Carbon Manufacturing with Merck Life Science

April 24, 2026

Industrial companies are being pushed to run tighter operations while cutting emissions and reporting more clearly. Most already have the data. It’s just scattered across too many systems.

That’s a data problem before it’s anything else.

We’re working with Merck Life Science to help bring that data together and make it usable. This project puts a working model in place for connecting complex industrial sites, where energy systems, utilities, and production processes need to be seen together.

Connecting Systems That Don’t Talk to Each Other

Manufacturing sites generate large amounts of data across equipment, utilities, and operational systems. Most of it sits in separate tools, which makes it hard to understand what’s actually going on.

Akila brings these data streams into one model. By integrating inputs from assets, utilities, and sensors, teams can see what’s happening across the site as it happens.

Electricity, water, gas, and renewable energy flows are viewed together. This makes it easier to spot waste and inefficiencies that are easy to miss when systems are tracked separately.

Making Energy Data Useful

Access to data isn’t the problem. What matters is how quickly teams can act on it.

With energy and operational data in one place, facility and operations teams can see where energy is being used, where it’s being lost, and how performance changes over time.

This shifts improvement from occasional audits to day-to-day decisions, with data feeding directly into how the site is run.

Tracking and Managing Emissions

As decarbonization becomes a priority, companies are expected to measure and report emissions more accurately.

Akila calculates emissions automatically using real-time and historical data, based on standard reporting frameworks. This reduces manual work and improves the consistency of ESG reporting.

It also helps teams stop looking backward and start managing emissions in real time. Carbon stops being just a report and becomes something teams manage day to day, alongside cost and performance.

Making This Work Across Sites

One-off projects don’t scale.

To reduce emissions across a portfolio, companies need systems that can be rolled out consistently across sites. By putting a shared data structure in place, teams can compare performance, track progress, and apply what works in one location to others.

This is how incremental improvements start to add up.

A Shift in How Manufacturing Operates

This is part of a wider shift across manufacturing. Companies are moving away from disconnected tools and toward systems that bring operations and sustainability data together.

We help teams get their data in one place and use it to run cleaner, more efficient sites.

Related Articles
Energy Data Needs Context

Energy Data Needs Context

The Energy Waste Most Buildings Never Notice

The Energy Waste Most Buildings Never Notice

From Reactive to Condition-based Maintenance

From Reactive to Condition-based Maintenance

Take the next step with Akila

If you want better from your buildings, our team is here to help. Let’s set up a call to discuss your needs and show you how Akila works, from deploying digital infrastructure to optimization.

910-Product-page
Secondary ~ Request Demo Simple

Akila EMEA receives the 2026 NVIDIA Industry Innovation Award

April 16, 2026

Today at NVIDIA’s EMEA Partner Day Keynote and Award Ceremony, Akila received the 2026 NVIDIA Industry Innovation Award.

The category recognizes one partner each year in the region for outstanding efforts, dedication and innovative spirit in the use of NVIDIA technologies.

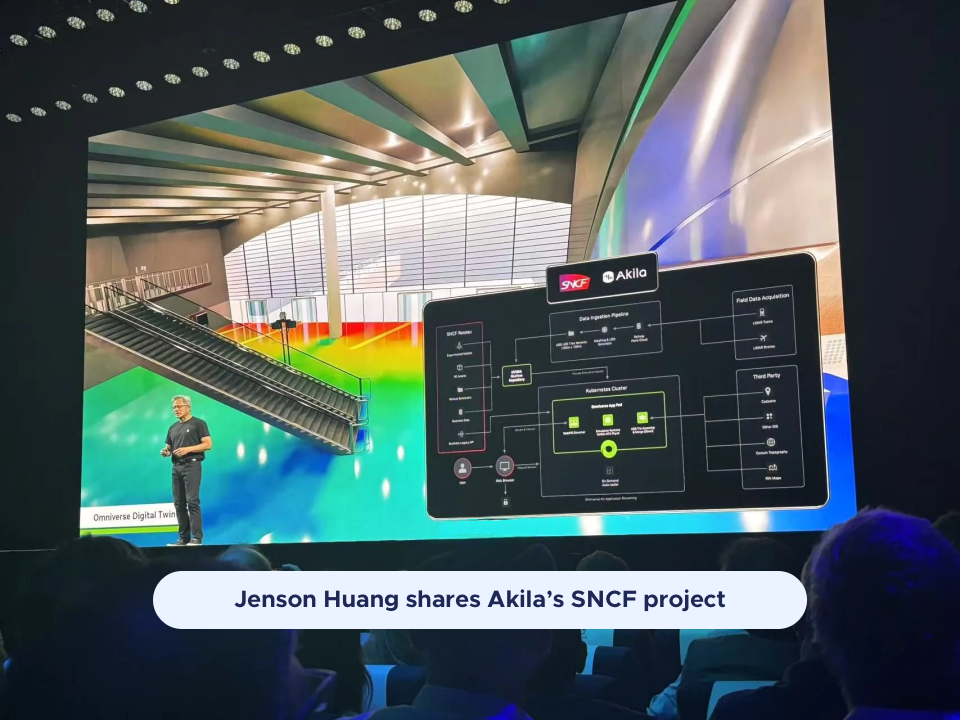
For Akila, the award follows a year of collaboration work with NVIDIA, including presentations at GTC Paris and Smart City Expo World Congress (SCEWC) in Barcelona. It also marks a year in which Akila moved from the NVIDIA Inception program into the NVIDIA Partner Network as an ISV partner. These demonstrations focused on large-scale, semantically rich digital twins for transport hubs, including SNCF Gares&Connexions, and smart campus environments such as UM6P, using NVIDIA Omniverse for visualization and simulation and NVIDIA Metropolis for vision AI and video analytics, alongside other NVIDIA technologies supporting operational use cases in the built environment.

Building the Operating System for Cognitive Buildings and Smart Spaces

The recognition of Akila points to a challenge that is becoming increasingly clear across the built environment. Buildings, campuses, infrastructure and cities are among the world’s largest and most operationally complex asset classes, carrying high capital value, major energy demands, significant safety responsibilities, and broad social and environmental impact. Yet much of the operational data within these environments remains fragmented across disconnected systems.

The work recognized through this award centers on using digital twin technology, AI agents and simulation to help bring those systems into a more unified operational environment. In Akila’s platform, data from building management systems, IoT, energy systems, CCTV, enterprise software, GIS and human activity can be connected in a way that gives operators a more complete and contextual view of how complex assets are performing. By combining live operational data, visualization, reasoning and simulation, Akila’s approach supports diagnostics, predictive operations and scenario-based decision-making across real-world environments.

This has been applied to a range of operational use cases in the built environment, including energy and airflow optimization, crowd and event management, safety monitoring, on-site performance simulation, multi-system orchestration and autonomous inspection.

It is also work carried out across a broad range of environments, from universities and large campuses to municipalities, transport infrastructure, logistics hubs, industrial facilities, shopping malls, mixed-use developments and office portfolios. Across these contexts, the operational focus has remained consistent: improving visibility, accelerating response, supporting better coordination and helping teams manage assets more effectively over time.

NVIDIA technologies referenced in selection process include:

  • NVIDIA Omniverse — visualization and simulation for large-scale digital twins
  • NVIDIA Metropolis — vision AI and video analytics
  • NVIDIA Cosmos Reason — contextual reasoning workflows
  • NVIDIA Isaac — robotics applications

For Akila, the award marks recognition from NVIDIA of a year of development and demonstration work at the intersection of digital twins, AI and operational technology in the built environment.

Related Articles
Energy Data Needs Context

Energy Data Needs Context

The Energy Waste Most Buildings Never Notice

The Energy Waste Most Buildings Never Notice

From Reactive to Condition-based Maintenance

From Reactive to Condition-based Maintenance

Take the next step with Akila

If you want better from your buildings, our team is here to help. Let’s set up a call to discuss your needs and show you how Akila works, from deploying digital infrastructure to optimization.

910-Product-page
Secondary ~ Request Demo Simple

Whitepaper: Future Ready Hotel Portfolios – Unlocking the digital twin & AI opportunity

March 19, 2026

The hospitality industry is entering a new era of operational pressure and opportunity.

Rising energy costs, increasing regulatory complexity, and ongoing labor constraints are forcing hotel owners and operators to rethink how their assets are managed. Traditional approaches, from manual processes to static building systems, are no longer enough to protect margins or ensure compliance.

Today, we’re proud to announce the release of Akila’s latest whitepaper:
“Future-Ready Hotel Portfolios: The Digital Twin & AI Opportunity.”

Proven Results in a New York City Hotel

The whitepaper also features a real-world deployment in a luxury hotel in New York City, one of the most demanding regulatory and cost environments globally.

Within just six months, the hotel achieved:

  • 206,025 kWh in electricity savings

  • $49,466 in reduced energy costs

  • $34,055 secured through Con Edison’s RTEM incentive program

With a projected payback period of approximately six months, the project demonstrates how software-led optimization can deliver fast, measurable ROI, while laying the foundation for long-term performance improvement.

Why This Matters Now

Across the industry, the pressure is structural, not temporary:

  • Utility costs have surged more than 27% since 2019

  • Operating costs are growing faster than revenue

  • Energy and carbon regulations are becoming mandatory in key markets

At the same time, energy remains one of the few cost categories that hotel operators can actively control.

This creates a clear opportunity:
move from reactive management to continuous, data-driven optimization.

From Fragmentation to Intelligence

In this whitepaper, we explore how digital twin technology is becoming a core operational layer for modern hotel portfolios.

Akila’s platform connects fragmented systems, from HVAC and energy meters to occupancy and BMS, into a unified, real-time intelligence layer. This enables:

  • Continuous energy optimization without major retrofit

  • Real-time visibility across assets and systems

  • AI-driven control strategies that adapt to changing conditions

  • Verified performance tracking aligned with compliance requirements

The result is a shift from static reporting to active operational control.

Beyond Cost Savings: A Strategic Shift

Digital twins are no longer experimental.

They are rapidly becoming essential infrastructure for hospitality operators looking to:

  • Reduce exposure to energy price volatility

  • Navigate evolving compliance requirements

  • Improve operational resilience across portfolios

  • Align sustainability goals with measurable outcomes

In a market where “sweating the asset” is the dominant strategy, the ability to continuously optimize performance without heavy capital investment is a decisive advantage.

Download the Whitepaper

The full report explores:

  • Key industry trends shaping hospitality in 2026

  • The role of AI and digital twins in modern hotel operations

  • A detailed breakdown of Akila’s technology architecture

  • How hotels can unlock incentives and verify performance

  • A step-by-step case study from deployment to ROI

👉 Download the whitepaper to learn how to future-proof your hotel portfolio with digital twins and AI.

Related Articles
Energy Data Needs Context

Energy Data Needs Context

The Energy Waste Most Buildings Never Notice

The Energy Waste Most Buildings Never Notice

From Reactive to Condition-based Maintenance

From Reactive to Condition-based Maintenance

Take the next step with Akila

If you want better from your buildings, our team is here to help. Let’s set up a call to discuss your needs and show you how Akila works, from deploying digital infrastructure to optimization.

910-Product-page
Secondary ~ Request Demo Simple

Akila and Resiliocs Intelligence launch climate risk management partnership

March 16, 2026

Akila and Resiliocs Intelligence have launched a new collaboration in which the two companies will work to help large portfolio owners and operators better understand, plan and manage climate risk across their assets.

Around the world, governments and infrastructure operators are being asked the same question: How do we prioritize investment across hundreds of buildings and critical assets while preparing for a changing climate?

This collaboration brings together complementary capabilities to tackle that challenge at portfolio scale.

Resiliocs Intelligence develops advanced, asset-level climate risk and adaptation modelling. Akila provides the AI-powered digital twin and data infrastructure that connects operational, environmental and asset data across entire portfolios.

By bringing these platforms together, we aim to extend the application of climate intelligence from analysis and planning into continuous portfolio insight and long-term asset management.

The goal is simple: enable large portfolio owners and operators to move from isolated studies to systemic, data-driven decision-making across hundreds of buildings and infrastructure assets — supporting long-term capital planning, resilience strategies and measurable progress over time.

The collaboration will focus on large-scale deployments and public-sector portfolios, where the need for climate-informed investment and AI-driven portfolio visibility is growing rapidly.

We look forward to working together to bring new capabilities to clients and explore opportunities where climate intelligence and digital twins can create the greatest impact.

Related Articles
Energy Data Needs Context

Energy Data Needs Context

The Energy Waste Most Buildings Never Notice

The Energy Waste Most Buildings Never Notice

From Reactive to Condition-based Maintenance

From Reactive to Condition-based Maintenance

Take the next step with Akila

If you want better from your buildings, our team is here to help. Let’s set up a call to discuss your needs and show you how Akila works, from deploying digital infrastructure to optimization.

910-Product-page
Secondary ~ Request Demo Simple

Akila and SIMPPLE Partner to Advance Autonomous, Data-Driven Facilities Management

January 28, 2026

We are proud to announce a new partnership between Akila and SIMPPLE Ltd. (NASDAQ: SPPL), bringing together two complementary approaches to the future of facilities management: connected building intelligence and autonomous robotic operations.

As buildings become more complex and expectations around efficiency, resilience, and sustainability continue to rise, facility teams are under increasing pressure to do more with fewer resources. This partnership is rooted in a shared belief that the next generation of facility operations will be driven by data, automation, and intelligent coordination between physical and digital systems.


Who is SIMPPLE?

SIMPPLE is a technology provider focused on autonomous facilities management, combining software, IoT devices, and purpose-built robotic systems to support real-world facility operations. Their solutions are designed to address everyday operational needs across commercial buildings and infrastructure, including cleaning, security, surveillance, inspections, and monitoring tasks.

What sets SIMPPLE apart is its focus on operational practicality. Their robots are not experimental concepts or lab prototypes, but systems designed to operate reliably in live environments, navigating complex facilities while collecting consistent, high-quality operational data. These robotic platforms are built to integrate into broader digital ecosystems, allowing the data they generate to be used alongside existing building systems rather than remaining siloed.


Why This Partnership Matters

Akila’s platform provides a unified digital twin and data foundation for buildings and portfolios, connecting real-time and historical data from building systems, energy infrastructure, sensors, and operational workflows. By integrating SIMPPLE’s autonomous robotics into this data environment, customers gain a more complete and actionable view of how their facilities are performing on the ground.

Through this collaboration, Akila and SIMPPLE will:

  • Integrate robotic operational data with connected building systems, enabling richer performance tracking and contextual insights
  • Combine physical observations from autonomous robots with building and energy data, improving visibility into facility health, resource usage, and efficiency trends
  • Support the deployment of robotic automation alongside digital workflows, reducing manual workloads and allowing operations teams to focus on higher-value, strategic tasks

This approach helps bridge the gap between what is happening physically in a building and how that information is analyzed, acted upon, and optimized at scale.


Enabling Smarter, More Resilient Operations

By aligning autonomous robotics with a centralized data and analytics platform, this partnership enables facilities teams to move from reactive operations toward more proactive and predictive management. Routine tasks can be automated, performance can be continuously measured, and insights can be shared across teams and portfolios with greater clarity.

Beyond operational efficiency, this collaboration also supports broader sustainability and resilience goals. Better data visibility enables more informed decisions around resource usage, maintenance prioritization, and long-term asset performance, helping organizations reduce waste while maintaining high service standards.


Looking Ahead

Together, Akila and SIMPPLE are working toward a more integrated model of facilities management, where robotics, data, and digital workflows operate as a cohesive system rather than isolated tools. This partnership represents an important step toward smarter, more adaptive built environments that can evolve alongside the needs of the people and organizations they serve.

We look forward to the impact we will create together as we help customers unlock new levels of productivity, operational resilience, and sustainability.

Related Articles
Energy Data Needs Context

Energy Data Needs Context

The Energy Waste Most Buildings Never Notice

The Energy Waste Most Buildings Never Notice

From Reactive to Condition-based Maintenance

From Reactive to Condition-based Maintenance

Take the next step with Akila

If you want better from your buildings, our team is here to help. Let’s set up a call to discuss your needs and show you how Akila works, from deploying digital infrastructure to optimization.

910-Product-page
Secondary ~ Request Demo Simple

Building the Cognitive Engine for Smart Spaces with NVIDIA DGX Spark

January 16, 2026

As buildings, campuses, and cities become increasingly instrumented, the challenge is no longer collecting data. The challenge is making sense of it in real time, close to where it is generated, and turning it into coordinated, intelligent action.

At Akila, this challenge sits at the heart of our platform. Our digital twin is not just a visual layer, but a living system that understands how assets, people, energy, and environments interact. To push this capability further, we are strengthening Akila’s agentic AI and orchestration engine with NVIDIA DGX Spark, bringing high-performance GPU computing to the edge and reinforcing the “brain” that powers cognition for smart spaces.


What is NVIDIA DGX Spark?

NVIDIA DGX Spark is a compact, high-performance GPU system designed to support the full lifecycle of modern AI workloads, from development and testing to deployment. It delivers the kind of accelerated computing traditionally associated with data centers, but in a form factor that can be deployed closer to operational environments.

For Akila, this means having a dedicated GPU compute foundation to run AI-intensive workloads at low latency, including:

  • Real-time video analytics

  • Sensor and meter data processing

  • AI agent reasoning and coordination

  • Spatial and simulation-driven intelligence

Rather than sending all data back to centralized cloud environments, DGX Spark allows critical AI inference and decision-making to happen closer to buildings, campuses, and districts themselves.


Why this matters for Akila

Akila is designed as an AI-native digital twin platform. We integrate real-time and historical data from equipment, energy systems, IoT sensors, and video streams into a unified, spatially anchored data referential. This foundation enables AI models not only to analyze data, but to understand context, relationships, and physical constraints.

DGX Spark strengthens this foundation by giving us the compute headroom to:

  • Develop and test GPU-heavy AI models faster

  • Run advanced inference pipelines with minimal latency

  • Prototype new AI-driven use cases without architectural compromises

In practical terms, it allows Akila to move beyond reactive analytics toward continuous reasoning and orchestration across systems.


Accelerating key capability areas

With DGX Spark under the hood, we are accelerating development across several core domains.

Agentic AI and reasoning at the edge
Akila’s agentic AI framework is designed to coordinate specialized AI agents that monitor, reason, and act across different domains, such as energy, comfort, safety, and operations. GPU-accelerated compute enables more advanced reasoning models to run closer to assets, supporting faster decisions and more autonomous behavior in complex environments.

Computer vision and spatial intelligence
Video is one of the richest but most compute-intensive data sources in the built environment. DGX Spark enables Akila to integrate computer vision capabilities such as occupancy awareness, safety monitoring, and spatial behavior analysis directly into the digital twin. These insights become spatially contextualized, allowing users to understand not just what is happening, but where and why.

Predictive building and infrastructure optimization
From energy consumption and cooling performance to equipment behavior, many optimization challenges depend on predictive, simulation-driven models. GPU acceleration allows Akila to advance these models, improving accuracy and enabling more frequent recalculation as conditions change in real time.


Akila as the orchestrator of the built environment

Beyond individual features, this step reinforces Akila’s broader role as an orchestrator and nervous system for the built environment.

Buildings and cities today rely on fragmented technologies, each optimized for a narrow function and rarely designed to work together. Akila’s platform connects these systems into a coherent digital twin, where data, AI models, and operational workflows are aligned spatially and temporally.

By pairing this orchestration layer with advanced GPU infrastructure, Akila can:

  • Coordinate multiple AI models and vendors within a single operational framework

  • Enable cross-domain intelligence across energy, operations, safety, and sustainability

  • Scale from individual buildings to portfolios, campuses, and urban districts


Built with the NVIDIA ecosystem

This work is developed in collaboration with partners across the NVIDIA Partner Network, building on proven experience deploying AI-driven digital twins for real-world environments. DGX Spark expands what we can prototype, demonstrate, and ultimately deliver, from smart buildings to smart campuses and cities.

As these capabilities are put to work in live projects, we will share more on how agentic AI, computer vision, and GPU-accelerated digital twins are reshaping how the built environment is designed, operated, and decarbonized.

More to come.

Related Articles
Energy Data Needs Context

Energy Data Needs Context

The Energy Waste Most Buildings Never Notice

The Energy Waste Most Buildings Never Notice

From Reactive to Condition-based Maintenance

From Reactive to Condition-based Maintenance

Take the next step with Akila

If you want better from your buildings, our team is here to help. Let’s set up a call to discuss your needs and show you how Akila works, from deploying digital infrastructure to optimization.

910-Product-page
Secondary ~ Request Demo Simple

Demand Forecasting: The Foundation of Smarter HVAC Systems

December 19, 2025


As buildings face rising energy costs, stricter sustainability targets, and higher expectations for occupant comfort, HVAC systems are under increasing pressure. Yet many inefficiencies do not come from outdated equipment or poor design. They stem from one core issue: HVAC systems are often operated reactively.

Traditional control strategies respond only after demand has already changed. A space warms up, occupancy increases, or outdoor conditions shift, and the system reacts with a delay. This lag drives unnecessary energy use, creates temperature instability, and increases mechanical stress across HVAC equipment.

Demand forecasting changes this dynamic.

By predicting heating and cooling requirements before they occur, HVAC systems can move from reactive operation to proactive control. This forecasting layer becomes the foundation for all advanced HVAC optimization strategies.


What Demand Forecasting Means in HVAC

Demand forecasting in HVAC refers to anticipating future heating and cooling needs across different time horizons. Rather than responding only to current conditions, the system evaluates how demand is likely to evolve over the next minutes, hours, or day.

Short-term forecasting captures immediate fluctuations, such as a sudden change in occupancy or a spike in outdoor temperature. Longer-term forecasting looks at predictable daily or seasonal patterns, allowing systems to prepare for upcoming peaks rather than reacting once they arrive.

When demand forecasting is accurate, HVAC systems operate with foresight instead of urgency.


Why Forecasting Matters

Without reliable demand forecasting, HVAC systems tend to overcorrect. They cool or heat spaces too aggressively, start too late, or compensate for uncertainty by running longer than necessary. Over time, this behavior leads to higher energy consumption, unstable comfort levels, and increased equipment wear.

Forecasting addresses this by providing visibility into what demand is coming next, not just what is happening now. This shift enables more measured, efficient, and stable HVAC operation.


Akila’s Approach to Demand Forecasting

Effective forecasting begins with understanding how a building behaves. Akila brings together real-time and historical building data, including environmental conditions, occupancy signals, and energy consumption, to form a complete picture of what drives demand.

Rather than focusing on raw data collection, the platform emphasizes interpretation. The goal is to understand how demand changes in response to weather, usage patterns, and operational schedules, and to turn that understanding into actionable insight.

Akila’s AI models generate demand forecasts across multiple time horizons. Short-term 20-minute predictions capture rapid changes that affect HVAC demand in real time, while longer-range 24-hour forecasts anticipate daily demand patterns. This combination allows buildings to respond quickly without sacrificing overall stability.

A key differentiator is thermal response modeling. Buildings do not respond instantly to change. By modeling thermal inertia over time alongside occupancy and scheduling patterns, Akila produces forecasts that are more accurate and less prone to overreaction.

Forecasting accuracy also improves over time. As the system observes real-world outcomes, AI models continuously learn and adapt, refining predictions as building behavior evolves.


From Forecasting to Smarter Decisions

On its own, demand forecasting already delivers operational value by improving visibility and planning. But its true importance lies in what it enables.

Accurate forecasts form the foundation for smarter HVAC decisions, including load optimization, peak demand management, and automated equipment control. These capabilities rely on forecasting to function effectively. Without it, optimization remains reactive and limited in impact.


The Impact for Building Owners and Operators

For building owners and operations teams, accurate demand forecasting translates into tangible outcomes. Energy is used more efficiently because spaces are conditioned only when necessary. Indoor environments remain more stable, reducing comfort complaints. Equipment operates more smoothly, helping extend asset lifespan and reduce maintenance burden.

Because the approach is hardware-agnostic, demand forecasting can be applied across portfolios that include different building types, ages, and regions.


Forecast First, Optimize Second

As HVAC systems become more intelligent and automated, demand forecasting is no longer optional. It is the prerequisite for meaningful optimization.

By understanding what demand is coming next, buildings can operate more efficiently, more comfortably, and more sustainably. In future articles, we’ll explore how these forecasts power real-time HVAC optimization and automated equipment scheduling.

But it all starts with forecasting.


Related Articles
Energy Data Needs Context

Energy Data Needs Context

The Energy Waste Most Buildings Never Notice

The Energy Waste Most Buildings Never Notice

From Reactive to Condition-based Maintenance

From Reactive to Condition-based Maintenance

Take the next step with Akila

If you want better from your buildings, our team is here to help. Let’s set up a call to discuss your needs and show you how Akila works, from deploying digital infrastructure to optimization.

910-Product-page
Secondary ~ Request Demo Simple

Building the next generation of smart campuses: Energy, operations, and video intelligence in education

December 11, 2025


Educational institutions today face a unique combination of operational pressures. Campuses are growing more complex to manage, students and faculty expect safer and more responsive environments, and administrators are under increasing pressure to reduce energy consumption and meet sustainability targets. As these needs expand, campuses must look for tools that provide better visibility, faster decision making, and long-term resiliency.

Akila supports this transformation by bringing campus operations, energy management, maintenance, and video intelligence together into a single, unified platform. For schools, universities, and research facilities, this creates a clearer, more actionable understanding of how their campuses are performing in real time.


Modern challenges across campus operations

Most educational environments face a similar set of hurdles. Large campuses often rely on aging or inconsistent infrastructure, with HVAC, utilities, and equipment spread across many different building types. Energy consumption is high, especially in spaces such as labs, dormitories, and lecture halls. Maintenance teams struggle with limited visibility and reactive workflows. On top of this, institutions need faster ways to understand what’s happening across campus – whether an incident needs review, a crowded area needs attention, or a room’s usage patterns suggest a better scheduling or energy strategy.

These challenges create inefficiencies that impact sustainability, campus experience, operational continuity, and planning.


A unified digital foundation for smarter campuses

Akila addresses these challenges through a holistic approach that connects building systems, equipment data, IoT devices, and video sources into a single platform. This gives administrators, facility teams, and safety staff a shared operational picture of the entire campus.

Optimized energy and HVAC performance

AI-driven analytics help institutions better understand how their buildings consume energy, alert teams to anomalies, and automatically adjust HVAC systems according to occupancy and usage patterns. Whether for classrooms, research spaces, or residential buildings, Akila delivers more efficient performance while still maintaining comfort and reliability. Clear energy baselining and carbon tracking also help institutions align to sustainability commitments and regulatory requirements.

Predictive maintenance and digital twin visualization

A campus-scale digital twin brings every asset and building into a clear 3D view, allowing teams to quickly locate equipment, understand system relationships, and respond faster. Condition-based maintenance ensures that faults are detected early and repairs are scheduled before they disrupt classes or operations. As campuses expand, this digital foundation becomes a critical tool for planning and long-term lifecycle management.

Video analytics for faster insights

As campus environments grow more dynamic, the ability to quickly understand what happened in a specific area or timeframe becomes increasingly important.

Akila integrates Video Search and Summarization (VSS) to make video data more accessible and efficient to use. Instead of manually reviewing long footage, teams can use AI to instantly search for relevant moments or generate concise summaries around an event window or location. This supports faster incident verification, better coordination, and a clearer understanding of activity patterns across the campus.

VSS is not positioned as surveillance technology – it is an operational intelligence tool that helps education institutions gain insights quickly, improve response times, and make more informed decisions about space utilization and campus planning.


Creating better learning environments

When energy management, maintenance, and video intelligence operate through a unified platform, campuses experience tangible improvements.

  • Learning spaces stay more comfortable and consistent.
  • Maintenance issues are addressed proactively rather than reactively.
  • Activity patterns reveal how buildings are truly used, supporting smarter scheduling and resource allocation.
  • Campus teams gain faster access to critical information during incidents or peak activity periods.
  • Sustainability strategies align more closely with real operational data.

These outcomes directly support the core mission of education institutions: providing safe, healthy, and empowering environments for students and staff.


Designed to scale across diverse campus environments

Akila is designed to scale seamlessly from single buildings to multi-campus portfolios. Institutions can standardize energy reporting, maintenance workflows, and operational practices across all locations while maintaining the flexibility needed for different building types and usage patterns.

This approach provides administrators with long-term digital governance and ensures consistency even as campuses expand, renovate, or adapt to new operational demands.


Building the future of digital education infrastructure

The future of campus operations will rely on integrated digital systems that combine energy intelligence, predictive maintenance, real-time visualization, and rapid video-based insights. By bringing these capabilities together, Akila helps educational institutions move toward safer, more efficient, and more sustainable campuses — all while empowering teams to make better decisions every day.

Related Articles
Energy Data Needs Context

Energy Data Needs Context

The Energy Waste Most Buildings Never Notice

The Energy Waste Most Buildings Never Notice

From Reactive to Condition-based Maintenance

From Reactive to Condition-based Maintenance

Take the next step with Akila

If you want better from your buildings, our team is here to help. Let’s set up a call to discuss your needs and show you how Akila works, from deploying digital infrastructure to optimization.

910-Product-page
Secondary ~ Request Demo Simple

How Akila’s Energy Flow Analysis unlocks new value for smart buildings

December 9, 2025

Understanding how energy moves through a building has always been one of the biggest challenges in facility and sustainability management. Data comes from everywhere including utility feeds, renewable systems, sub-meters, sensors, and BMS points,but it rarely comes together in a way that reveals the full picture. Most systems can tell you how much energy a building uses. Very few can show you where that energy comes from, how it’s distributed, and what (or who) is driving the demand.

Akila’s improved Energy Flow Analysis feature is built to change that. By turning fragmented, complex data into a complete, intuitive, and shareable map of energy from supply to final consumption, it gives organizations the clarity they need to understand performance, improve coordination, and take faster, data-backed action.


The problem: Energy data without structure creates blindspots

Modern buildings generate enormous volumes of information. Yet the systems designed to interpret that information often struggle with transparency.

  • Energy supply is split across grid feeds, renewables like PV systems, and sometimes backup generators or batteries.
  • Consumption is scattered across tenants, equipment categories, operating schedules, and zones.
  • Different teams create their own diagrams or spreadsheets, leading to inconsistencies and duplicated work.
  • Portfolio managers struggle to benchmark sites because each building reports energy differently.
  • Facility teams are left reacting to peaks and inefficiencies rather than preventing them.

Without a structured and intuitive way to visualize the entire energy chain, even the best teams are making decisions in the dark.


Introducing Akila’s enhanced Energy Flow Analysis

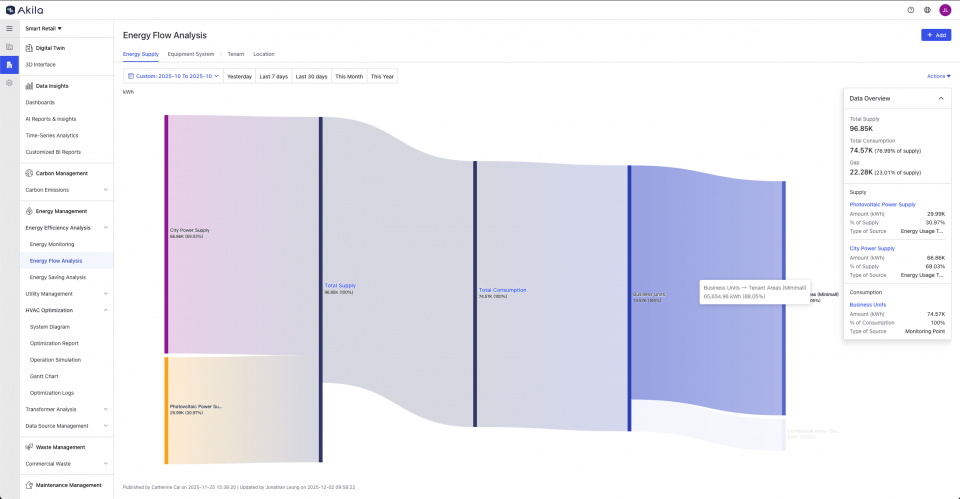
Akila’s Energy Flow Analysis creates a complete end-to-end map of where your building’s energy comes from and where it goes. Built on top of a detailed digital twin, the feature transforms raw datapoints into a cohesive energy story.

What sets Akila apart is its powerful, flexible IoT integration framework. Akila seamlessly connects to a wide variety of data sources including electricity meters, water meters, smart sockets, environmental sensors, and legacy BMS points across multiple protocols (MQTT, HTTP API, FTP, and more). This adaptability is the result of years of integrating with both local and global IoT suppliers, as well as third-party and legacy systems.

Whether your building uses locally sourced hardware or a unified global supplier, Akila’s platform ensures that every relevant datapoint is captured, structured, and made available for analysis. Our reusable integration scripts and standardized data models guarantee that energy flow insights are consistent, scalable, and reliable across diverse building portfolios and regions.

With this feature, users can:

  • Visualize the full supply-to-consumption energy journey.
  • See relationships between energy sources, equipment groups, zones, and tenants.
  • Compare real-world flows against expected patterns.
  • Spot anomalies, inefficiencies, and underperforming assets instantly.
  • Align cross-functional teams around one shared view of building performance.

Rather than jumping between multiple sources of truth, teams get a unified energy picture that is accurate, real-time, and actionable.


How it works

Akila begins by integrating data from every relevant source: grid import meters, onsite renewable systems like PV arrays and batteries, tenant sub-meters, equipment-level sensors, and BMS points. This raw data is then cleaned, time-aligned, and mapped into the building’s digital twin, creating a consistent, structured foundation for analysis.

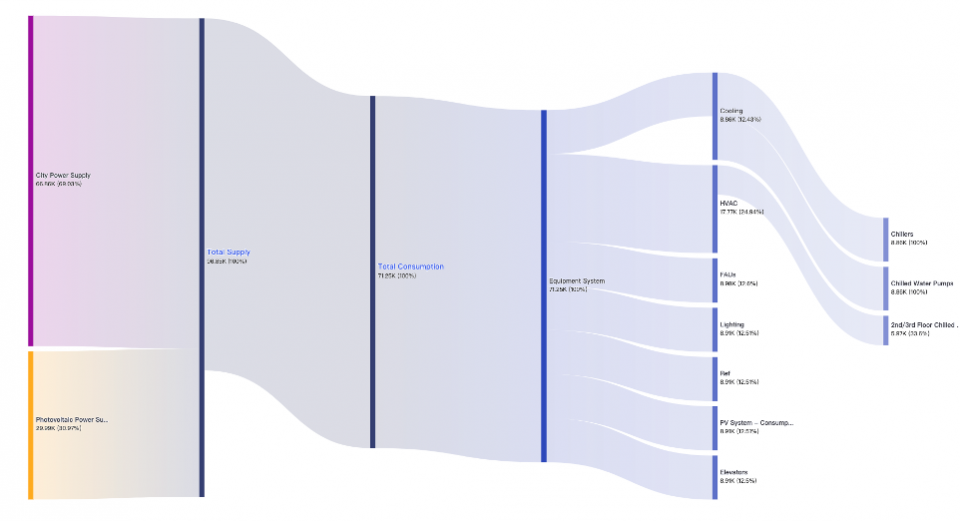
Once the data is organized, Akila generates a dynamic supply-to-load energy flow diagram that visually traces how energy moves through the building – from input sources all the way to consumption by equipment and zones. This intuitive visualization makes it easy to see dependencies, identify bottlenecks, and understand the true story behind energy use.

Finally, these insights are actionable. They inform and enable predictive maintenance, optimization strategies, and reporting workflows, allowing teams to react quickly or even automate responses through Akila’s control features. The result is a unified, real-time understanding of building energy that supports smarter decisions at every level.


Three ways users gain immediate value

  1. Supply side intelligence – Understanding where energy comes from

For buildings using a mix of grid electricity, PV generation, and battery storage, understanding energy supply is critical.

Akila breaks down exactly how much energy is coming from each source and how those sources are being used.

This enables users to:

  • Measure real renewable self-consumption rates.
  • Identify when PV underperforms and diagnose why.
  • Shift loads away from expensive grid periods.
  • Optimize the building’s cost and emissions strategy.

The result is a clearer understanding of your energy mix and more confident decisions around purchasing, scheduling, and sustainability.


  1. Tenant breakdowns – Transparent and fair energy attribution

For multi-tenant buildings, energy transparency is often a pain point. Manual sub-meter reads, inconsistent billing logic, and disputes can eat resources and erode trust.

Akila solves this by breaking down energy consumption by tenant, with data mapped directly to the 3D digital twin.

This gives property managers and owners the ability to:

  • Accurately attribute consumption for billing or reporting.
  • Identify tenants with unusually high load intensity.
  • Highlight savings opportunities specific to each tenant.
  • Reduce disputes through clear, verifiable consumption records.

Improved transparency strengthens landlord-tenant relationships and supports better long-term planning.


  1. Equipment System breakdown – Benchmarking what drives demand

Not all systems contribute equally to a building’s energy load. HVAC may dominate in one building, while pumps or industrial equipment dominate in another.

Akila visualizes consumption by equipment category so users can understand which systems are responsible for which portion of total demand.

This helps teams:

  • Benchmark equipment performance against design values or peer buildings.
  • Spot equipment types with recurring inefficiencies.
  • Prioritize maintenance, upgrades, or operational tuning where it matters most.
  • Detect early signs of equipment degradation through rising energy intensity.

Instead of looking at building-wide totals, operators get detailed clarity on what’s driving energy use.


Why this matters for the future of smart buildings

Energy Flow Analysis closes one of the biggest gaps in building management: the lack of a unified, intuitive, and actionable understanding of how energy moves through the built environment.

With this feature, teams can:

  • Shift from reactive firefighting to predictive planning.
  • Align sustainability and operations teams around shared, trusted data.
  • Build more accurate forecasts and budgets.
  • Support audits, compliance, and ESG reporting with confidence.
  • Unlock new optimization pathways powered by AI and automation.

As buildings grow more complex and energy costs rise, this level of clarity is no longer a nice-to-have — it’s essential.


Related Articles
Energy Data Needs Context

Energy Data Needs Context

The Energy Waste Most Buildings Never Notice

The Energy Waste Most Buildings Never Notice

From Reactive to Condition-based Maintenance

From Reactive to Condition-based Maintenance

Take the next step with Akila

If you want better from your buildings, our team is here to help. Let’s set up a call to discuss your needs and show you how Akila works, from deploying digital infrastructure to optimization.

910-Product-page
Secondary ~ Request Demo Simple