Greenhouse gas (GHG) emissions are the leading cause of climate change. Understandably, they are the target of a growing amount of regulation and scrutiny from the government, financial institutions, and shareholders. While in the past, businesses might have been able to get away with rough or estimated data about their contributions to GHG emissions, this is no longer the case as regulations such as carbon reporting and ESG standards increase their reporting requirements.
GHG reporting usually follows the categorization of emissions into three scopes. Scope 1 and 2 are direct or indirect emissions owned by the company, while scope 3 emissions are those that come from the supply chain, product use, or other upstream or downstream activities in the value chain. Because scope 1 and 2 emissions result from the direct actions of an organization, Akila can play an important role in helping to reduce them.
Setting up Akila on your site can provide lifetime value for monitoring, tracking, and acting on scope 1 and 2 emissions. In three stages, Akila can put you on your way to reducing your carbon footprint.
Know your scope 1 and 2 carbon profile
Before deploying Akila, the organization needs to establish what will be included in the carbon inventory or carbon profile with a focus on scope 1 and 2 emissions. This is an essential first step to managing risks and identifying areas of improvement. Without this foundation, your organization may as well be lost at sea – even with the most advanced ship.
Although the definition of scope 1 and 2 emissions are highly standardized, there are further questions that each organization needs to ask before they begin to track and act.
What are the reporting standards or methods for my organization?
The best starting place for creating a framework for information collection is having a clear picture of the type, extent, and format of data required. There are a wide variety of standards a given organization might want to adhere to.
Listed firms, for example, might be required to file ESG disclosures which can vary depending on the market. Does your regulator follow SASB, GRI, or both?
On top of this, there may be a different set of standards for compliance carbon markets (cap-and-trade or Emissions Trading Systems) or carbon reporting. Furthermore, there is a long list of voluntary sustainability disclosures that an organization might wish to track, such as Ecovadis or CDP.
Knowing how scope 1 and 2 emissions fit into each of these standards is a good first step toward data collection and action.
Which are the organizational boundaries included in the scope 1 and 2 inventory? What about the operational boundaries?
Organizational boundaries are defined as the entities (subsidiaries, joint ventures, partnerships) and assets (facilities, vehicles) belonging to an organization. Once these boundaries are set, GHG emissions will need to be consolidated for reporting. These boundaries must be consistent across all reporting and disclosure, otherwise, there is direct risk in the form of non-compliance or indirect risk in the form of public perception of “greenwashing.”
On the other hand, operational boundaries define the specific source of emissions, such as boilers, chillers, or purchased electricity. This phase of the inventory is where we begin to deploy Akila.
Deploy Akila
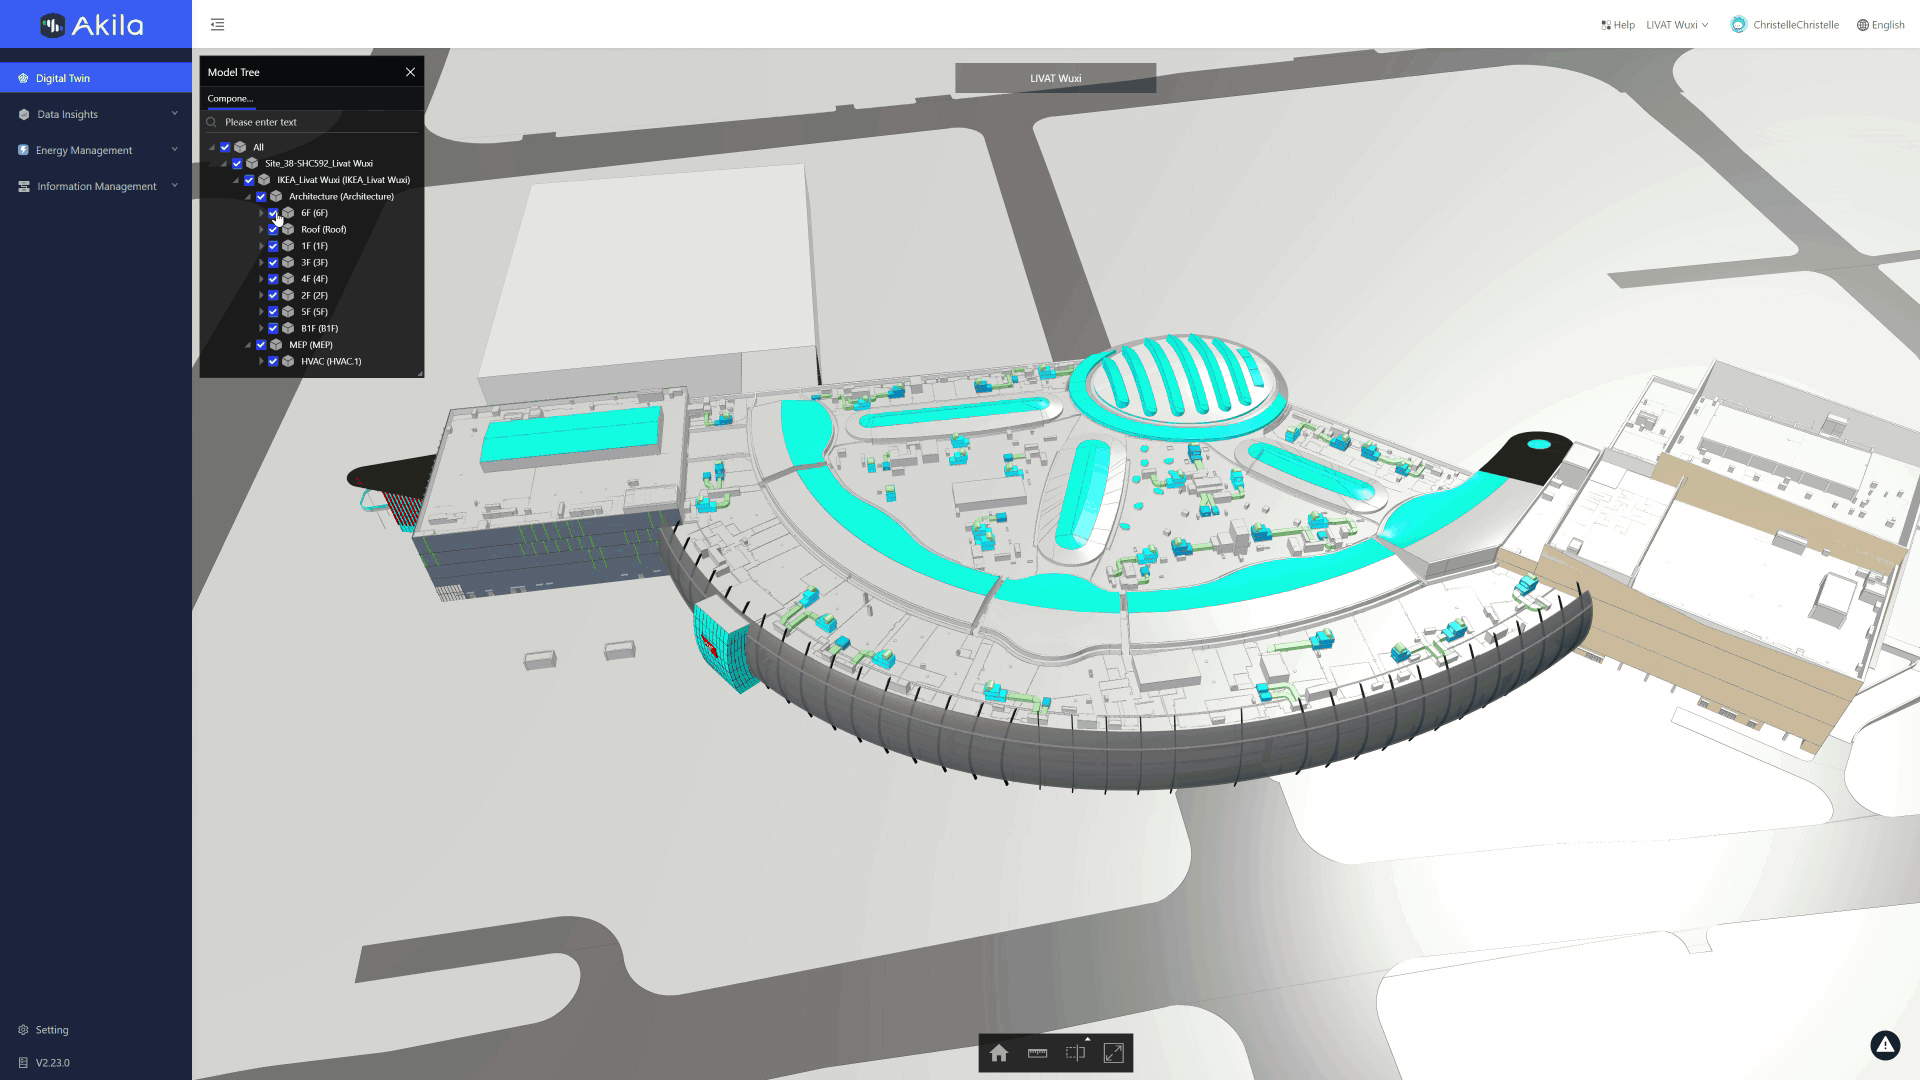
In step 1, Akila consultants work with an organization to define the goals, scope, and standards of data to be collected. Then we get to work building a digital twin of your site.
Akila begins with either existing or custom-made CAD or BIM files to create a 1-to-1 digital model of your building and assets. Then, it is brought to life with IoT. Our engineers connect all meters, equipment, and systems with hardware that sends data back into the platform and brings the building alive.
For scope 1, that includes:
- Gas boilers (stationary combustion)
- Chillers, HVAC, fire suppression (fugitive emissions)
- Vehicles (mobile emissions) *via upload
For scope 2, that includes monitoring purchased fuels such as:
- Electrical meters
- Steam meters
- Thermal energy
Once outfitted with IoT hardware, this data is collected in a centralized platform for monitoring, analysis, and optimization in the Akila Energy Suite.
Using Akila Energy Suite
The Energy Suite is packed with tools for monitoring, analyzing, visualizing, and reporting scope 1 and 2 emissions. These features are also designed to aid the decision-making process for carbon reduction. However, Akila Energy can also integrate with AI optimization tools through API connections or Edge networks.
Dashboarding & analytics
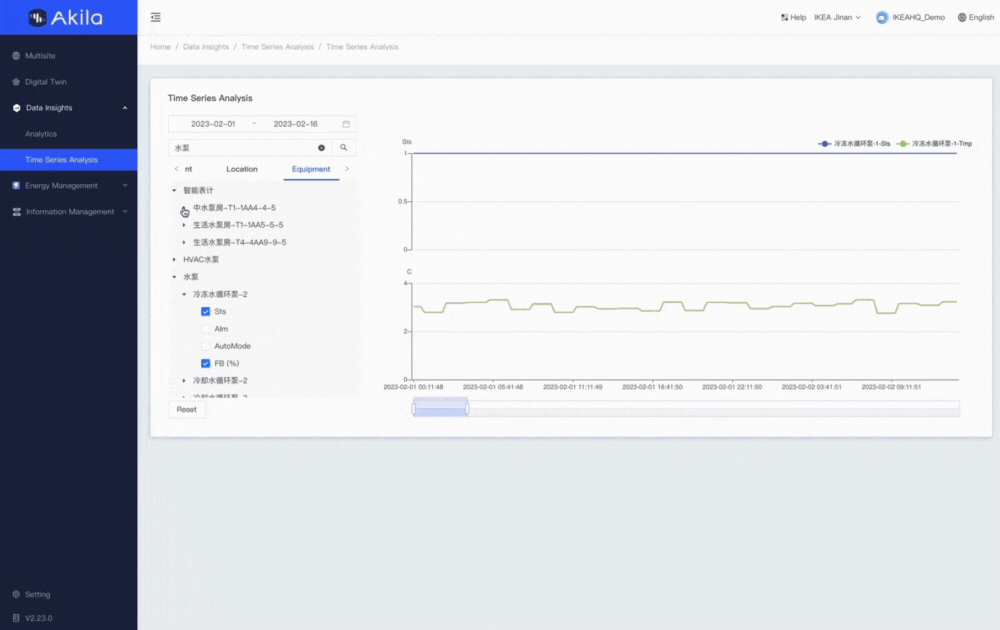
Visualizing your data can help drive a better understanding of operations and inform better decision-making. Akila Energy includes customizable dashboards that can track both energy use and carbon emissions with the data sent from your equipment. This data can be drilled down to the exact time and location of its source.
For example, users can start at the global level to see all combined energy use and emissions across a property portfolio, then go down to the building, then to the system (such as HVAC), and down to the equipment meter itself. Time series analysis allows users to view asset performance at a highly granular level, and even cross-reference with other equipment, systems, and locations.
BI reporting
Following the work done in step 1, Akila includes a reporting function with BI templates aligned with organizational reporting needs. Reports can follow a variety of standards, such as a variety of ESG or green building reports, and can also be tailor-made for each customer. These reports are easily exported and shared within the organization or directly to regulators or auditors themselves.
Third-party integration
While the Akila platform and Energy Suite are powerful tools to monitor and analyze scope 1 and 2 emissions data, they can go even further beyond by integrating third-party software. For example, if an organization would like to integrate AI-backed HVAC optimization, these tools can be brought inside the Akila platform to track how effectively the program can reduce energy use and emissions.
Akila strives to be an all-in-one platform and will continue to provide support for as many innovative, carbon-cutting tools as possible to centralize energy and emissions management.
Take action
Akila provides businesses with a fully transparent look at their GHG data and enables them to take real action to reduce their carbon footprint. The insight provided by Akila might lead organizations to retrofit their site with more efficient equipment. It might also be the factor behind transitioning to a fleet of electric vehicles to reduce the scope 1 emissions caused by mobile combustion.
With data collected and action underway, Akila continues to deliver value to users by providing transparent, traceable, and trackable data. This cycle of optimization can set businesses on the path toward reaching net-zero scope 1 and 2 emissions.
Reducing scope 1 and 2 emissions is crucial for slowing climate change. Knowing how to collect and act on scope 1 and 2 emissions data will become less and less voluntary as time goes on, whether via ESG disclosures or government compliance. By providing a comprehensive view of emissions data, Akila enables businesses to create a carbon inventory, collect and track emissions data, and take action to reduce their carbon footprint.