If you follow Akila and the digital twin industry, you already know the term “smart building.” What is the underpinning data that makes a smart building smart and lets it perform more efficiently and sustainably than a traditional structure? Time series analysis data is some of the most important.
Smart building management is largely driven by BMS (Building Management System) data, allowing portfolio managers to formulate measured operation plans from wind speed, temperature, illumination intensity, valve position, and more. In the past decades, data has mostly been captured manually and intermittently. For example, the average temperature over a set period is often taken as one major reference for building energy efficiency management. There is, however, a flaw – the average temperature may stay within a fixed data section, concealing the data changes which would be meaningful for anomaly detection and operation forecast. To operate at optimum, consistent and highly granular BMS data is essential – the answer is to bring in “time” as a crucial data variable and realize time series analysis.
High granularity reveals valuable metrics
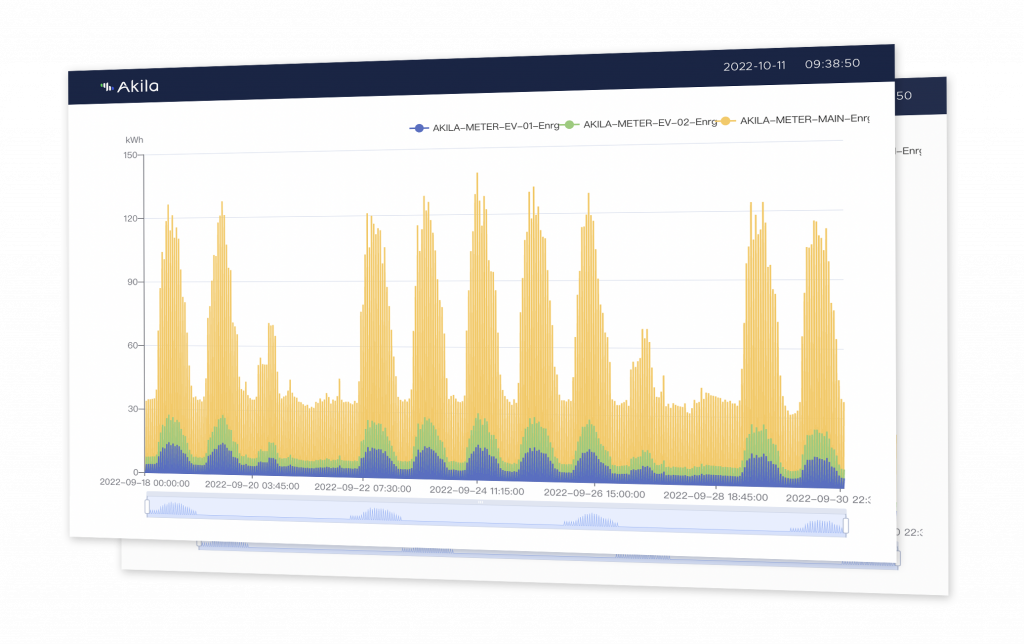
What is time series data? It is a consistent sequence of data points obtained through repeated measurements from the same source and placed in time order. Time series analysis transforms the traditional method of updating data into a real-time recorded data point so that it can visualize data changes and variations, create a basis for comparative analysis, and turn data into KPIs and indicators.
If we go back to the example of temperature data, but now with time series analysis, it is possible to visualize and compare temperature with other data (such as cloud cover, precipitation, and wind speed) tracked by the minute, which outlines a more detailed and complete picture of operational performance and increases optimization opportunities. Starting early this year, Akila supports sub-minute level time granularity in time series analyses. It is currently applied to a wide range of measurement scenarios on the Akila platform – operation, energy, HVAC, and indoor environment quality (IEQ) sensors.
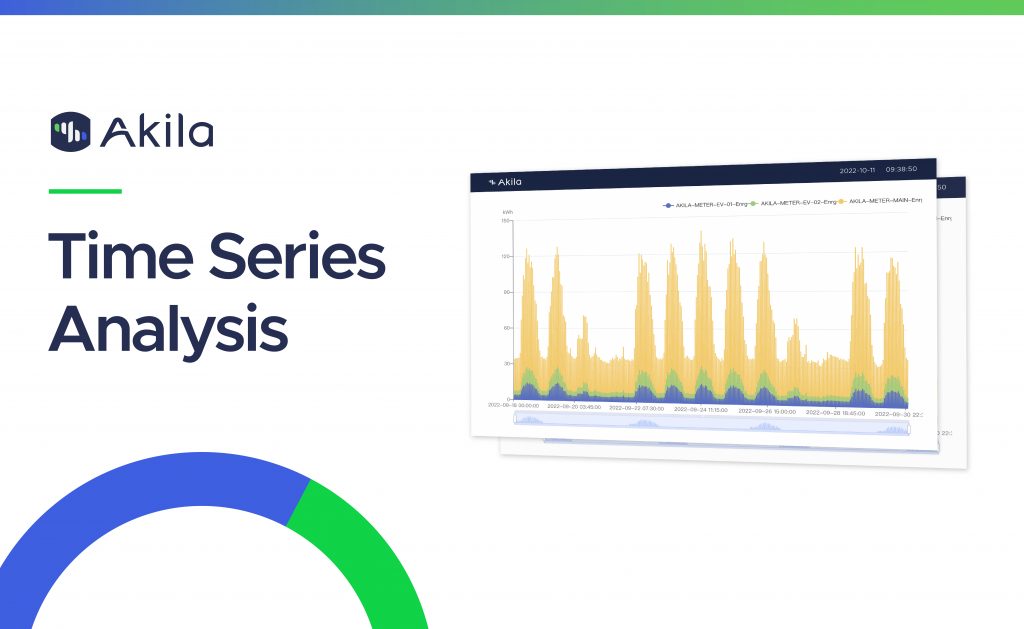
Understanding the past, present and future
In the building management industry, time series analysis lifts the precision of fault detection and diagnostics (FDD) to a higher level than ever. On the Akila platform, analysts can integrate real-time data points from various equipment including (but not limited to) sensors, controllers, coils, dampers, air handling units, and variable air volume systems. Integrated with AI and machine learning algorithms, time series data can be assessed through operation logic and translated into actionable information.
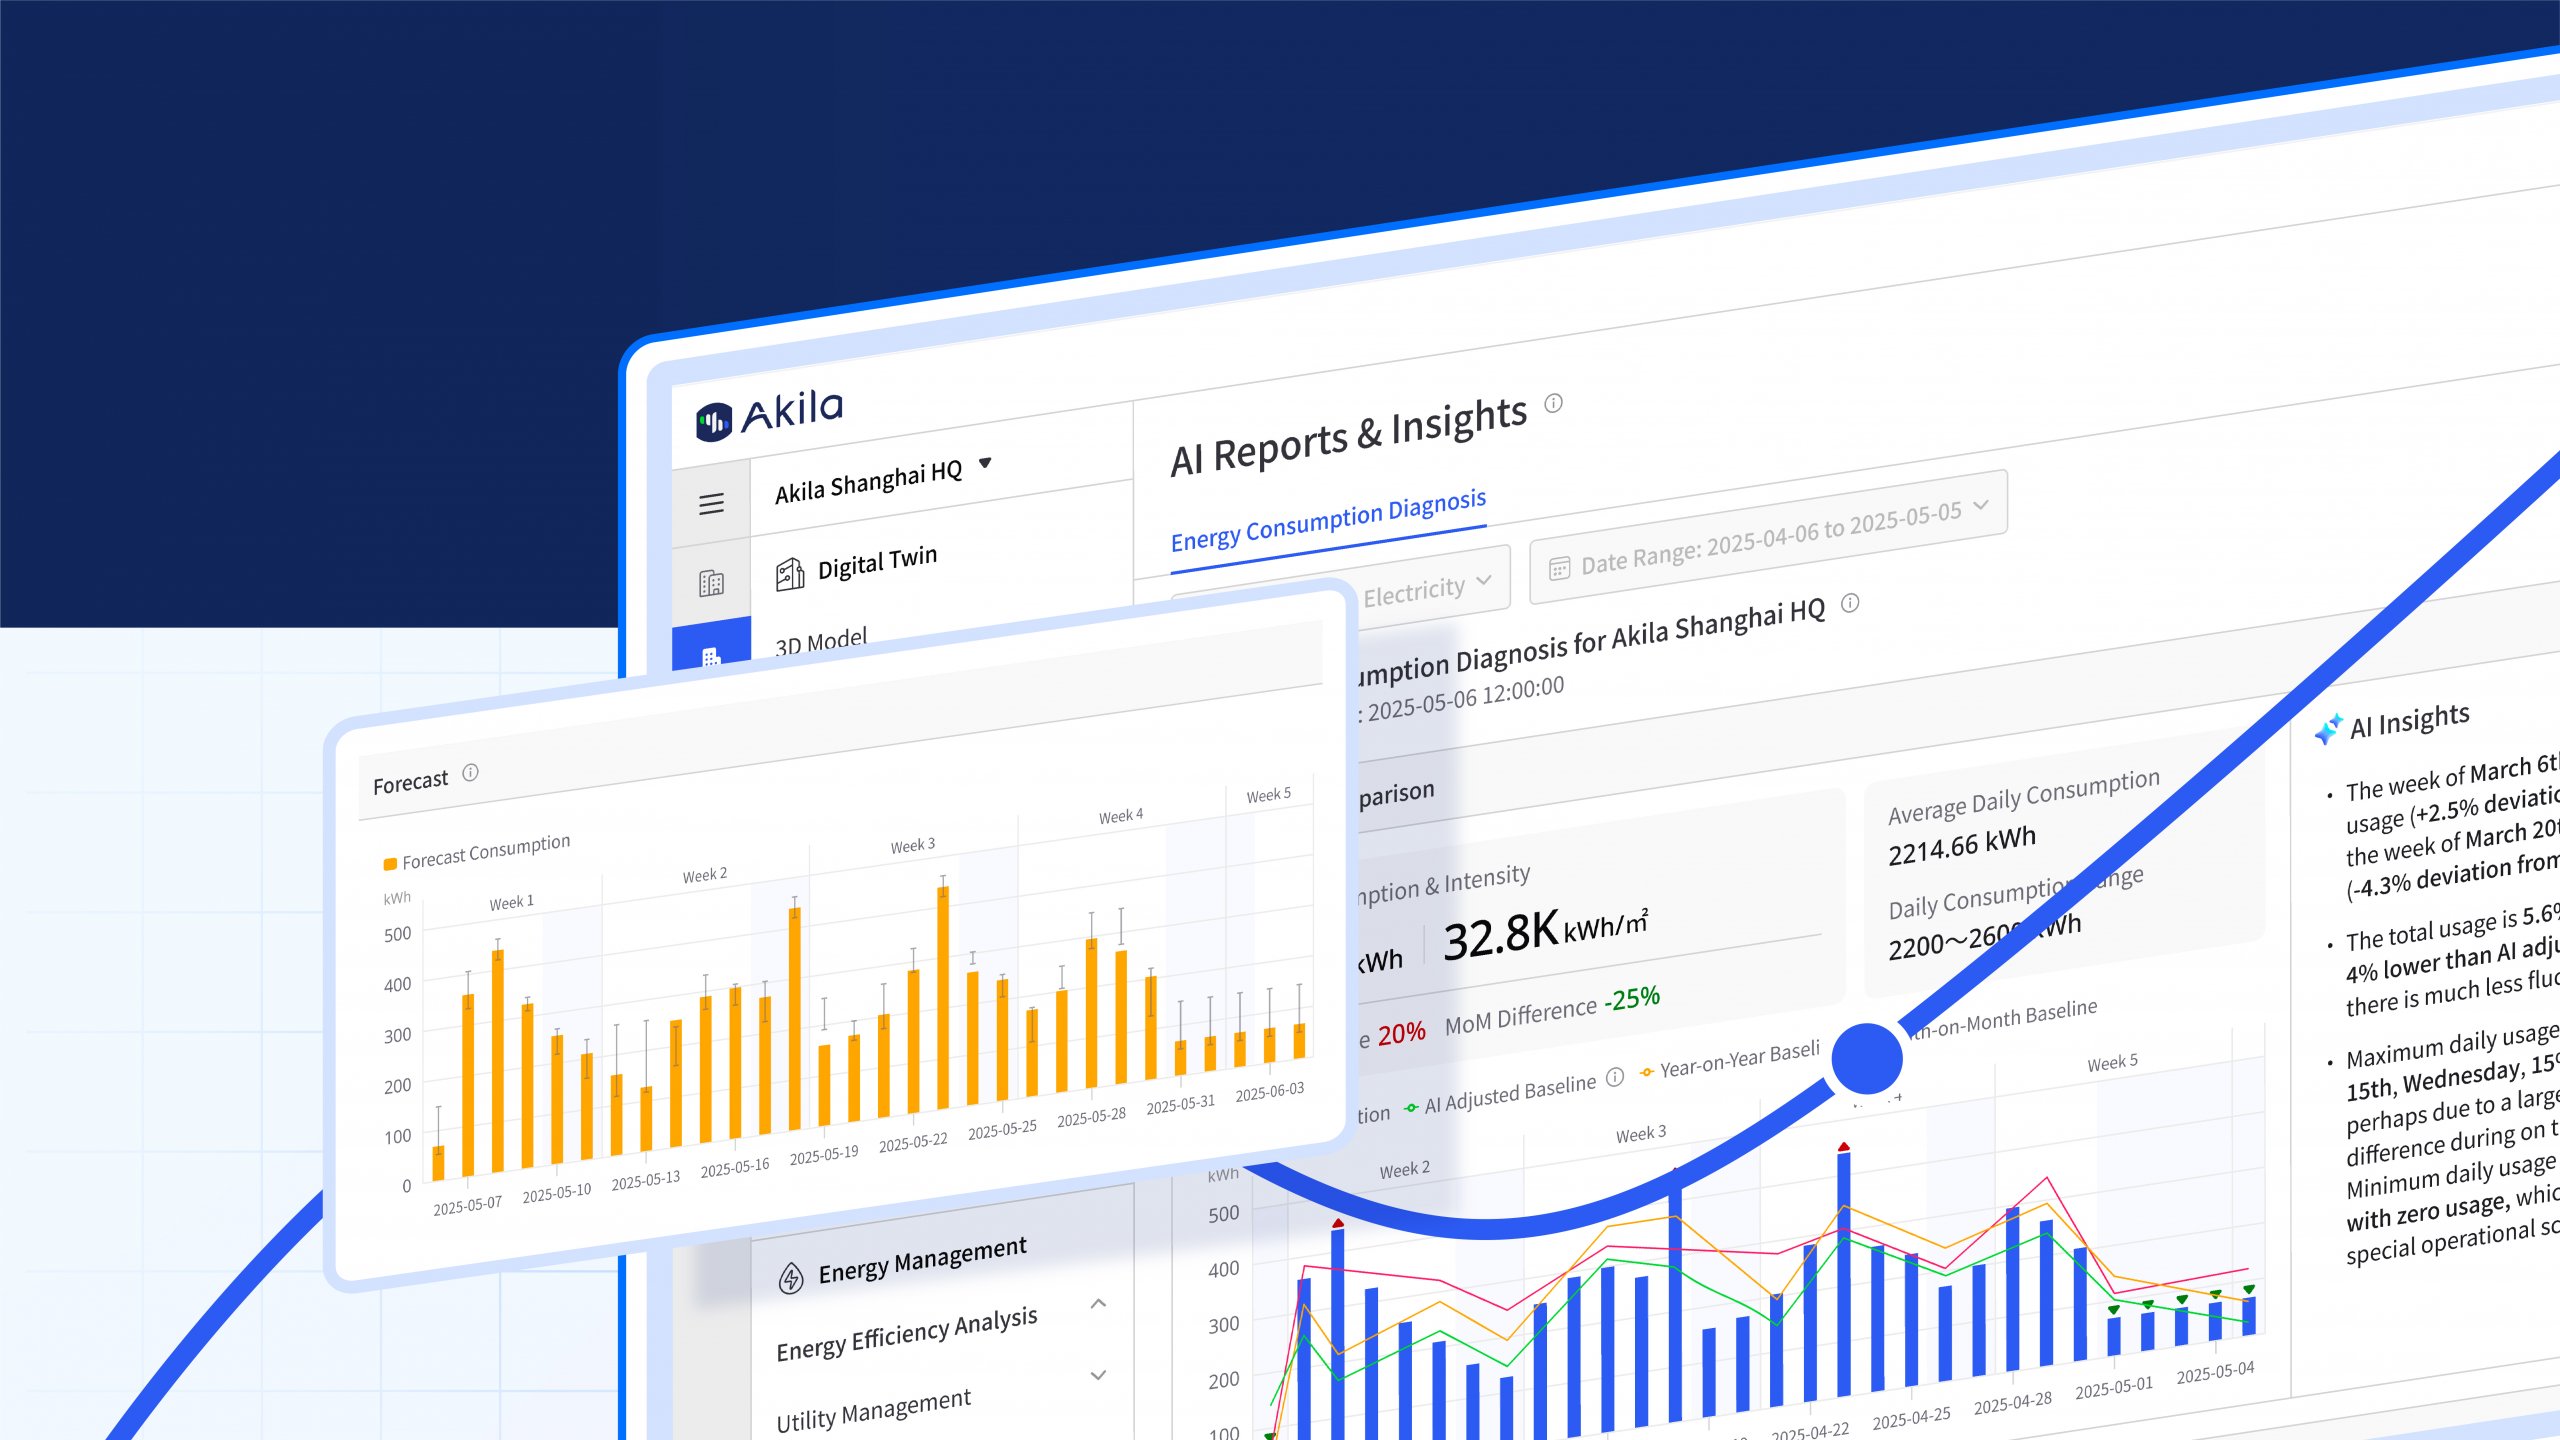
How does it work? When operational errors, manual overrides, or failed devices are leading to a failure or a loss of performance, the faults can be immediately reflected on the time series charts, such as a certain length of noise in the data, abnormal benchmarking, or deviation from baseline. For users of Akila, instant FDD alarms will be sent to them based on time series analysis, and Akila will continue tracking the resolution of the alarms through time series analysis and work orders to make sure the completion of FDD management.
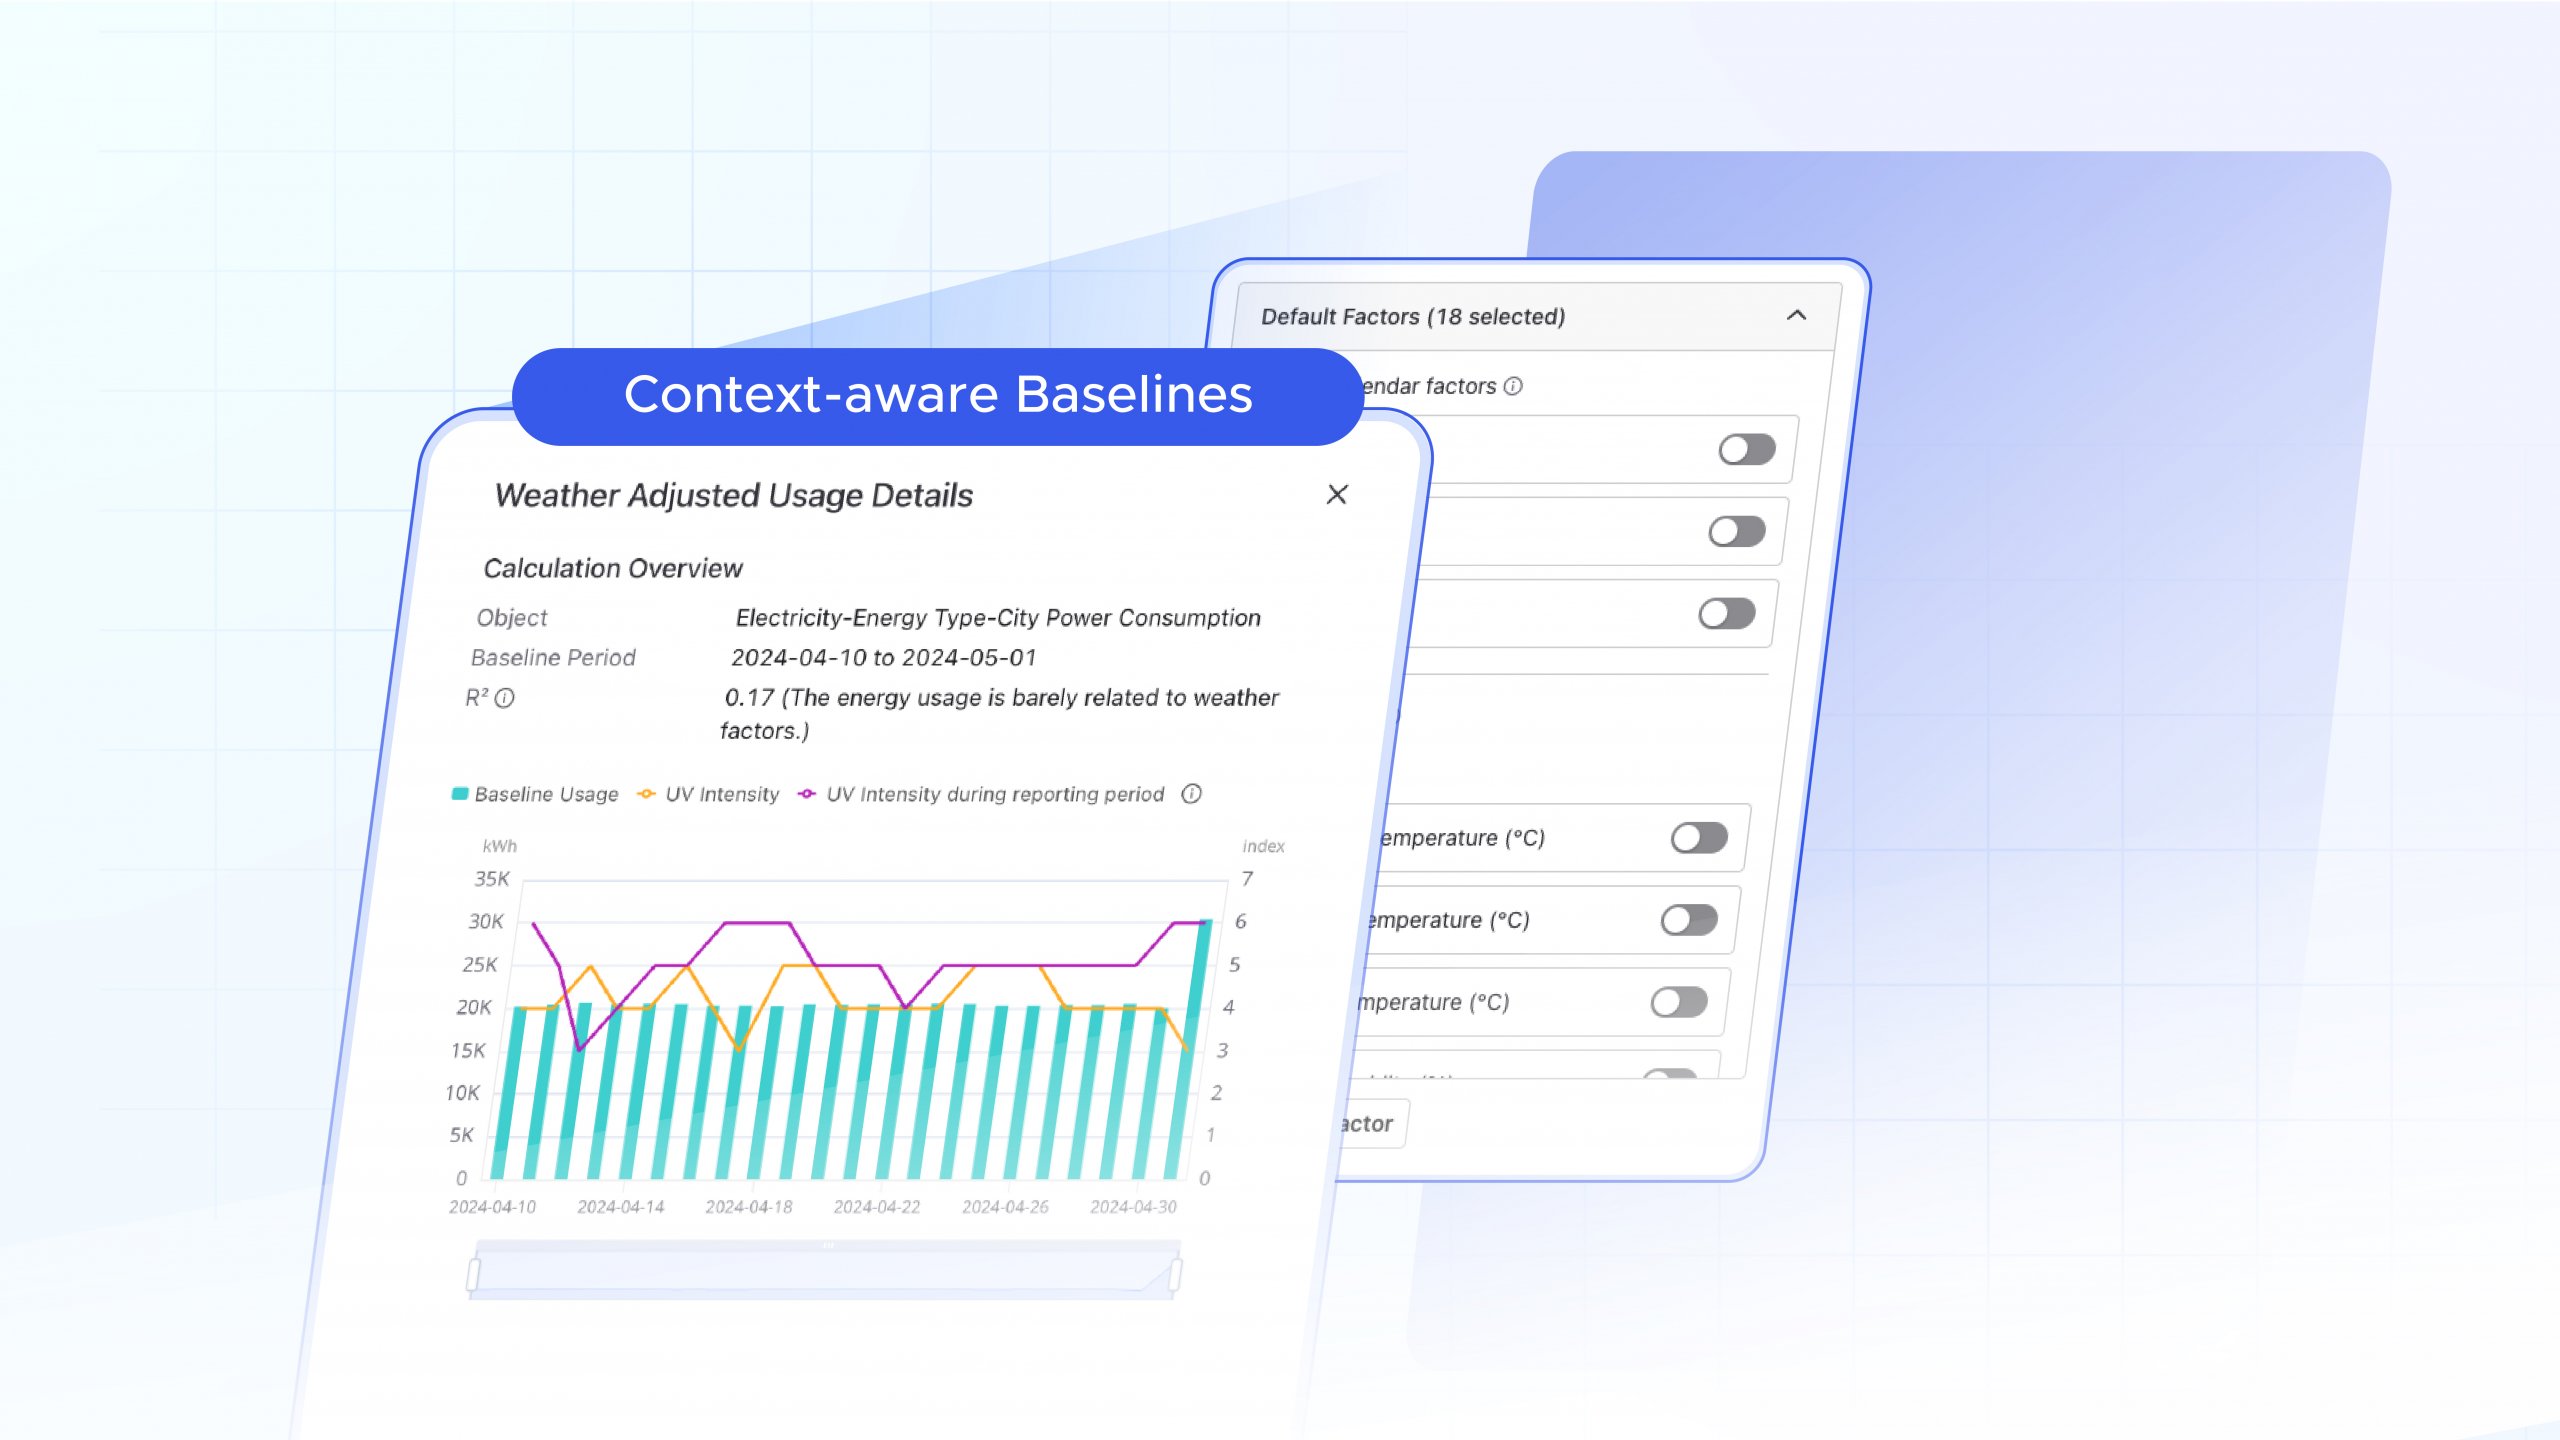
Additionally, time series data can be leveraged for performance prediction based on historical data and real-time weather data, setting guidelines for predictive and preventive measures. For example, energy and HVAC optimization are highly correlated with the seasons. A customized view can be created using Akila to compare the energy consumption to the set baseline to visualize the performance and predict the savings. If the prediction tells negative outcomes, portfolio managers can dive into possible factors, identify the problems (e.g. a valve is leaking or stuck, a new air filter is needed), and optimize.
Akila brings you more
Time series analysis is powerful but demands quality infrastructure to unleash its capability. The first and most important prerequisite to realizing time series analysis is to collect clean data, otherwise, valuable data will be buried in noisy raw data. Deploying sophisticated and expensive sensors would be the ultimate solution, but besides that, Akila can help in a software way – backed up by the profound partnership with Microsoft, Akila has built with Azure tools an advanced data extract, transform and load (ETL) process that can largely reduce the noise of sensor data and transfer clean data for analytics. Another prerequisite is the safe storage of time series data. Historically, sensor data points would be stored only for a limited time and are easily lost. Built on the cloud, Akila manages a tremendous volume of data, making long-term time-based analysis feasible.
Designed as a single source of truth data platform, Akila integrates a wide scope of inputs, covering the whole lifecycle of a building, including indoor, energy, and operational data types. It extends the potential of comparative analysis and modeling and helps reveal the truth by sourcing every single piece of evidence. And it creates the perfect environment for streamlining and optimizing ESG reporting. Akila’s ESG analytics are investment-grade as it enables real-time identification of ESG risks. Compared to those relying on traditional ESG platforms that need to wait until the end of the year to evaluate their ESG targets. Akila provides its users the chance to detect ESG performance problems and fix them before too late.