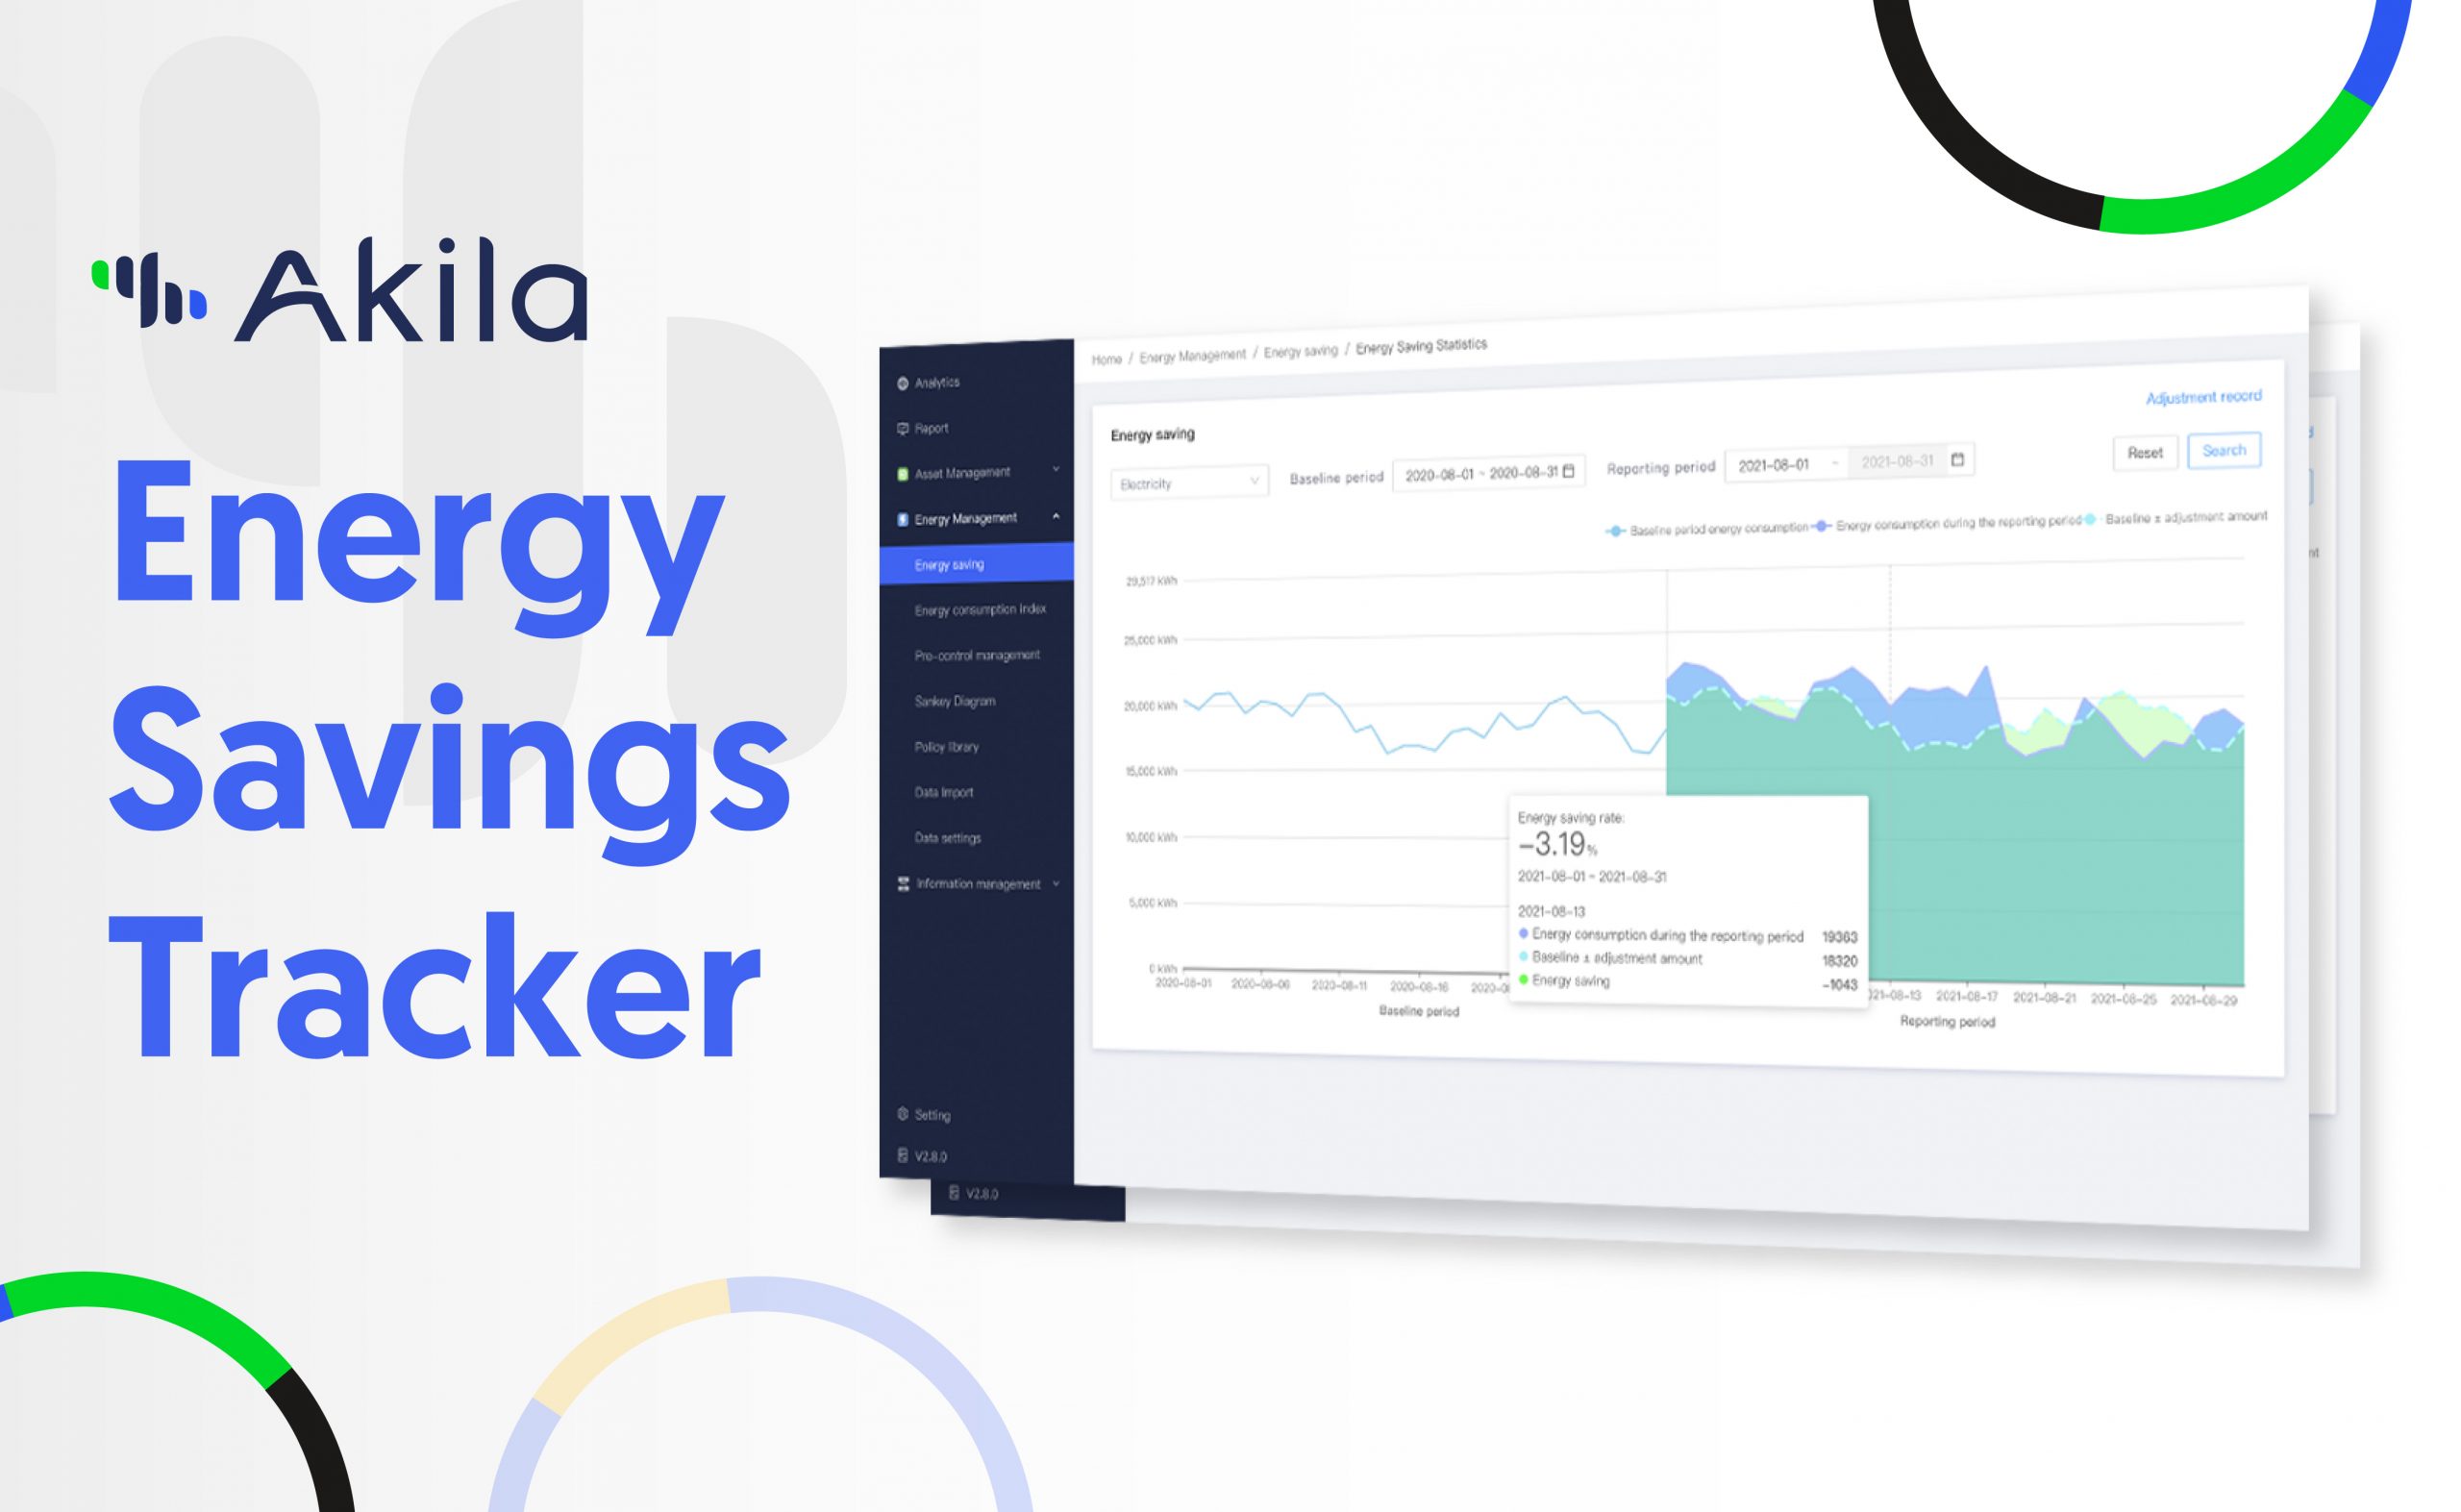
Understanding how energy moves through a building has always been one of the biggest challenges in facility and sustainability management. Data comes from everywhere including utility feeds, renewable systems, sub-meters, sensors, and BMS points,but it rarely comes together in a way that reveals the full picture. Most systems can tell you how much energy a building uses. Very few can show you where that energy comes from, how it’s distributed, and what (or who) is driving the demand.
Akila’s improved Energy Flow Analysis feature is built to change that. By turning fragmented, complex data into a complete, intuitive, and shareable map of energy from supply to final consumption, it gives organizations the clarity they need to understand performance, improve coordination, and take faster, data-backed action.
The problem: Energy data without structure creates blindspots
Modern buildings generate enormous volumes of information. Yet the systems designed to interpret that information often struggle with transparency.
- Energy supply is split across grid feeds, renewables like PV systems, and sometimes backup generators or batteries.
- Consumption is scattered across tenants, equipment categories, operating schedules, and zones.
- Different teams create their own diagrams or spreadsheets, leading to inconsistencies and duplicated work.
- Portfolio managers struggle to benchmark sites because each building reports energy differently.
- Facility teams are left reacting to peaks and inefficiencies rather than preventing them.
Without a structured and intuitive way to visualize the entire energy chain, even the best teams are making decisions in the dark.
Introducing Akila’s enhanced Energy Flow Analysis
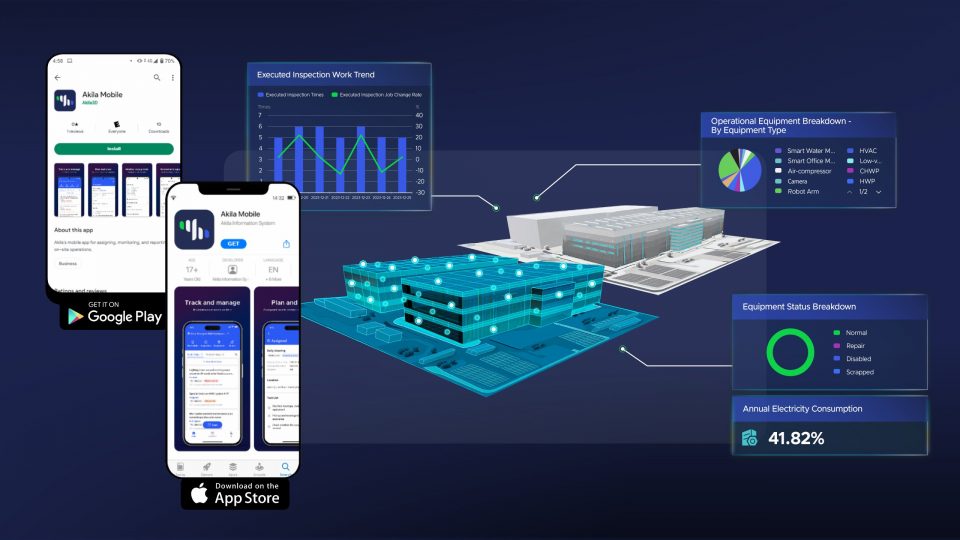
Akila’s Energy Flow Analysis creates a complete end-to-end map of where your building’s energy comes from and where it goes. Built on top of a detailed digital twin, the feature transforms raw datapoints into a cohesive energy story.
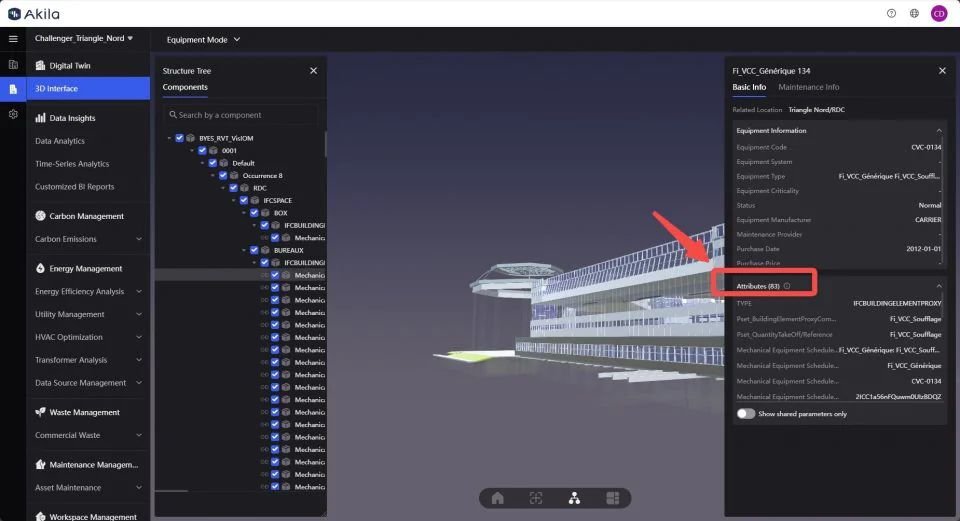
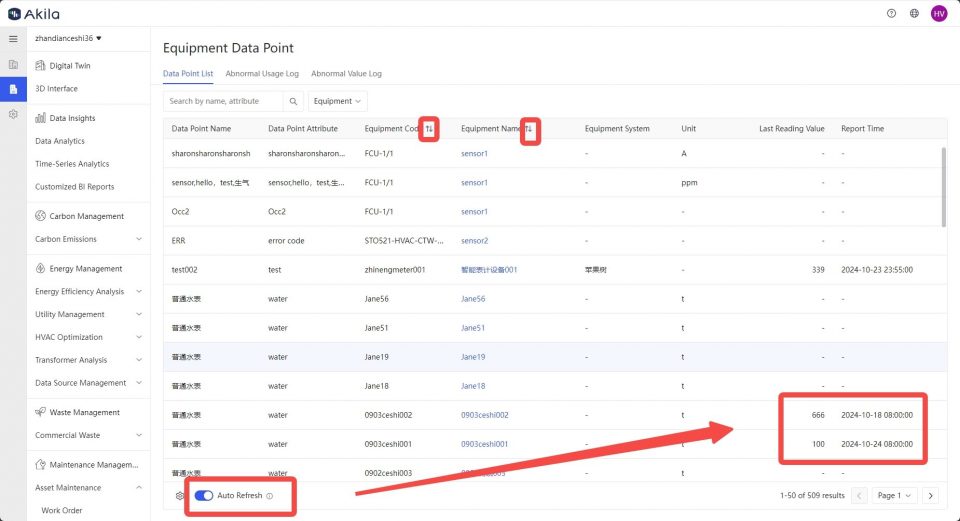
What sets Akila apart is its powerful, flexible IoT integration framework. Akila seamlessly connects to a wide variety of data sources including electricity meters, water meters, smart sockets, environmental sensors, and legacy BMS points across multiple protocols (MQTT, HTTP API, FTP, and more). This adaptability is the result of years of integrating with both local and global IoT suppliers, as well as third-party and legacy systems.
Whether your building uses locally sourced hardware or a unified global supplier, Akila’s platform ensures that every relevant datapoint is captured, structured, and made available for analysis. Our reusable integration scripts and standardized data models guarantee that energy flow insights are consistent, scalable, and reliable across diverse building portfolios and regions.
With this feature, users can:
- Visualize the full supply-to-consumption energy journey.
- See relationships between energy sources, equipment groups, zones, and tenants.
- Compare real-world flows against expected patterns.
- Spot anomalies, inefficiencies, and underperforming assets instantly.
- Align cross-functional teams around one shared view of building performance.
Rather than jumping between multiple sources of truth, teams get a unified energy picture that is accurate, real-time, and actionable.
How it works
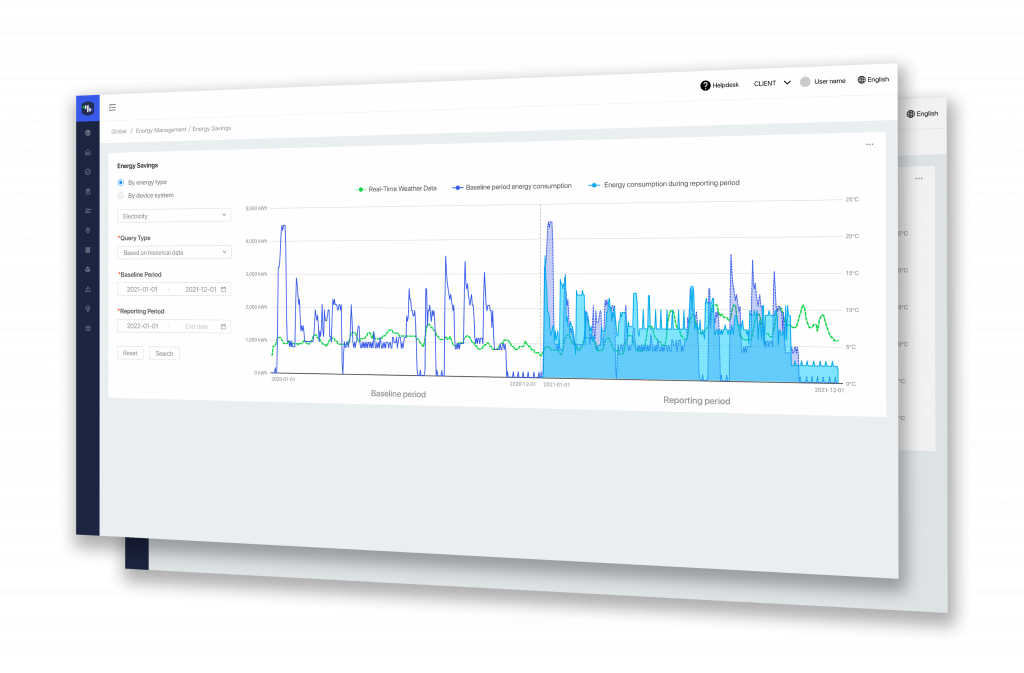
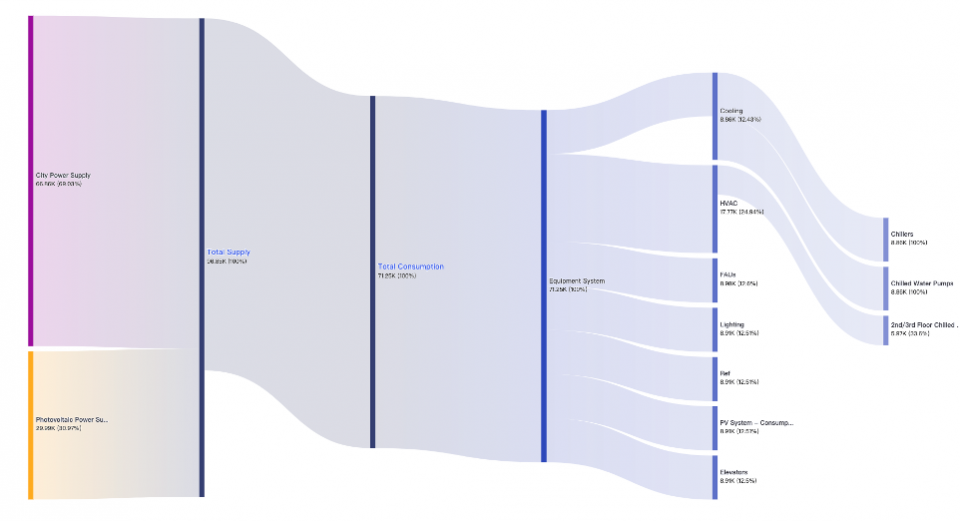
Akila begins by integrating data from every relevant source: grid import meters, onsite renewable systems like PV arrays and batteries, tenant sub-meters, equipment-level sensors, and BMS points. This raw data is then cleaned, time-aligned, and mapped into the building’s digital twin, creating a consistent, structured foundation for analysis.
Once the data is organized, Akila generates a dynamic supply-to-load energy flow diagram that visually traces how energy moves through the building – from input sources all the way to consumption by equipment and zones. This intuitive visualization makes it easy to see dependencies, identify bottlenecks, and understand the true story behind energy use.
Finally, these insights are actionable. They inform and enable predictive maintenance, optimization strategies, and reporting workflows, allowing teams to react quickly or even automate responses through Akila’s control features. The result is a unified, real-time understanding of building energy that supports smarter decisions at every level.
Three ways users gain immediate value
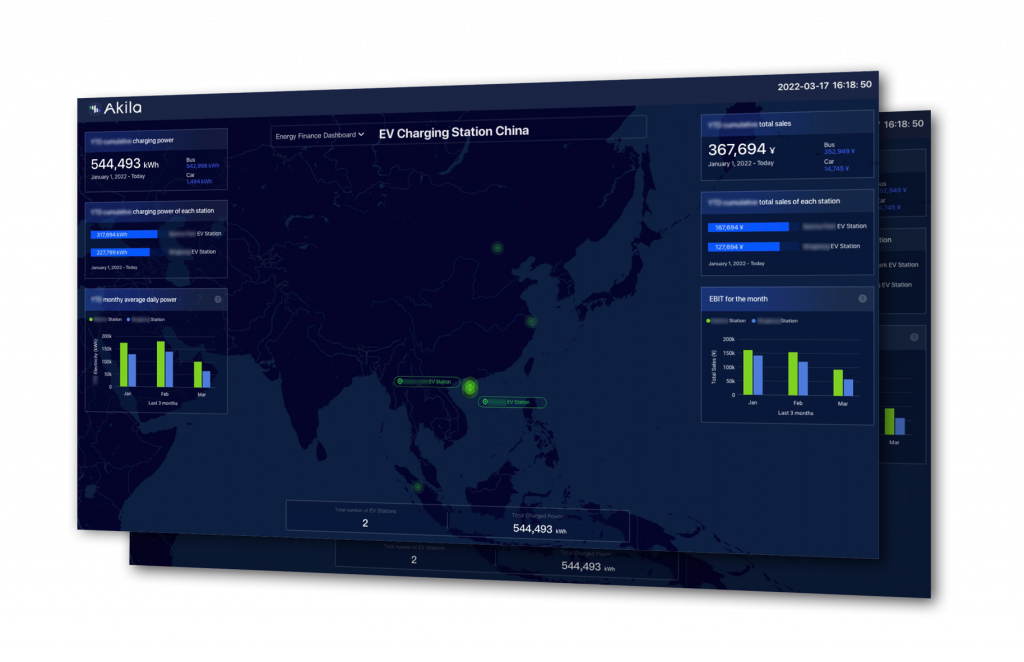
- Supply side intelligence – Understanding where energy comes from
For buildings using a mix of grid electricity, PV generation, and battery storage, understanding energy supply is critical.
Akila breaks down exactly how much energy is coming from each source and how those sources are being used.
This enables users to:
- Measure real renewable self-consumption rates.
- Identify when PV underperforms and diagnose why.
- Shift loads away from expensive grid periods.
- Optimize the building’s cost and emissions strategy.
The result is a clearer understanding of your energy mix and more confident decisions around purchasing, scheduling, and sustainability.
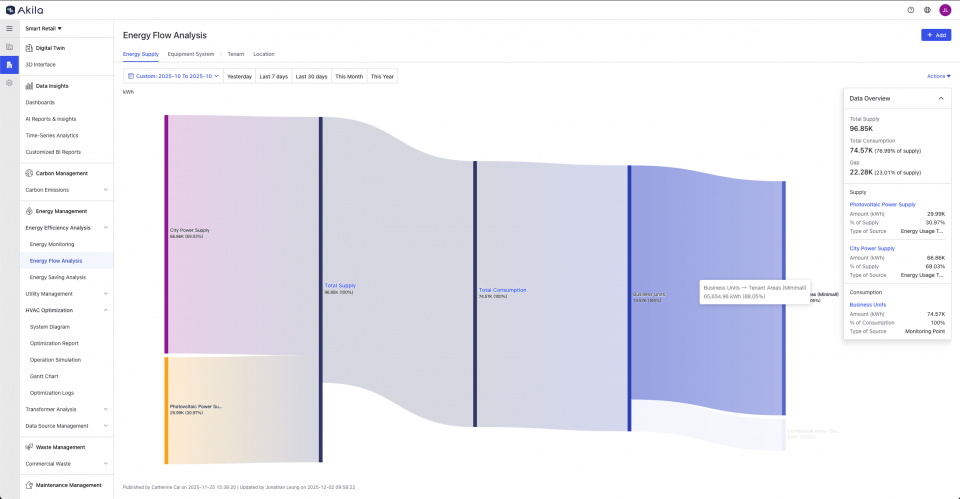
- Tenant breakdowns – Transparent and fair energy attribution
For multi-tenant buildings, energy transparency is often a pain point. Manual sub-meter reads, inconsistent billing logic, and disputes can eat resources and erode trust.
Akila solves this by breaking down energy consumption by tenant, with data mapped directly to the 3D digital twin.
This gives property managers and owners the ability to:
- Accurately attribute consumption for billing or reporting.
- Identify tenants with unusually high load intensity.
- Highlight savings opportunities specific to each tenant.
- Reduce disputes through clear, verifiable consumption records.
Improved transparency strengthens landlord-tenant relationships and supports better long-term planning.
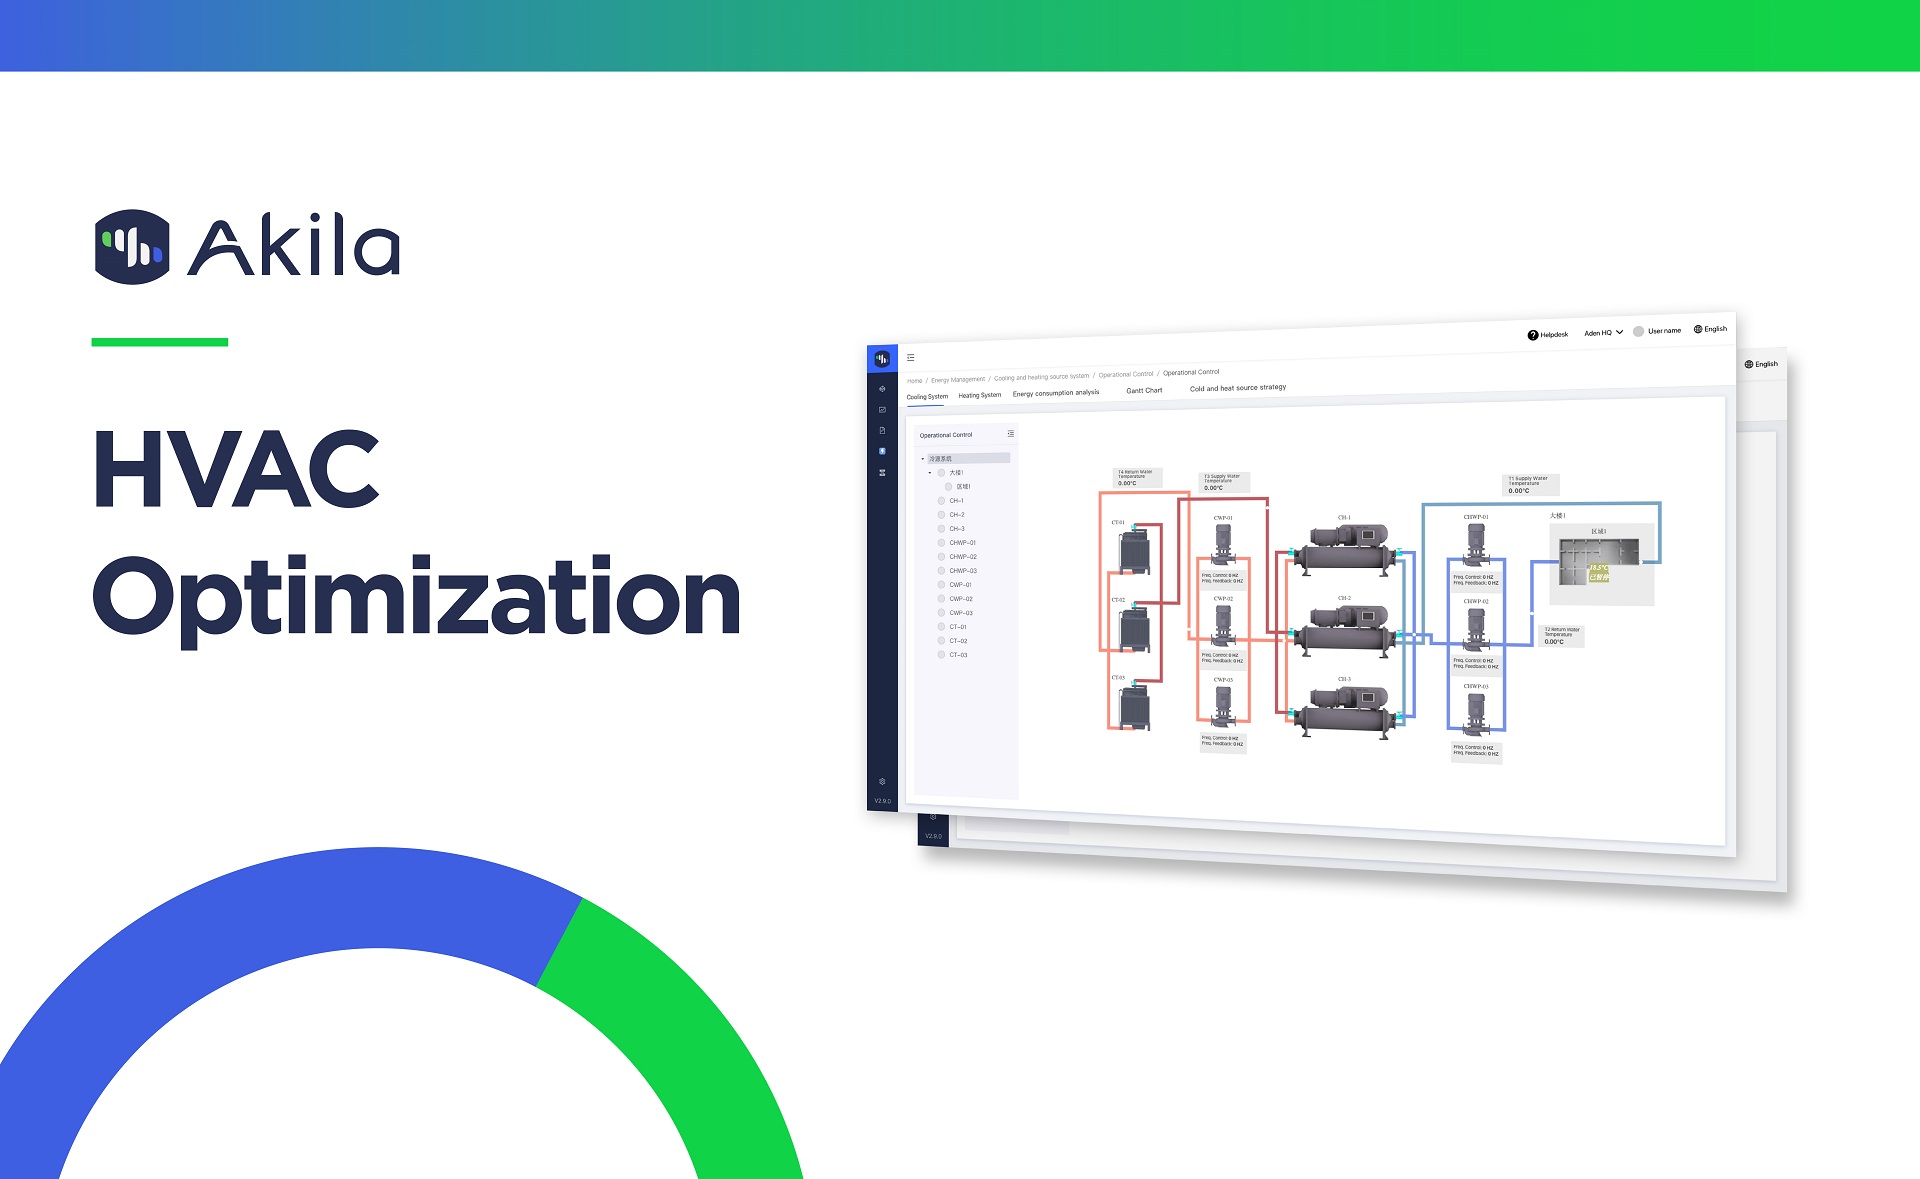
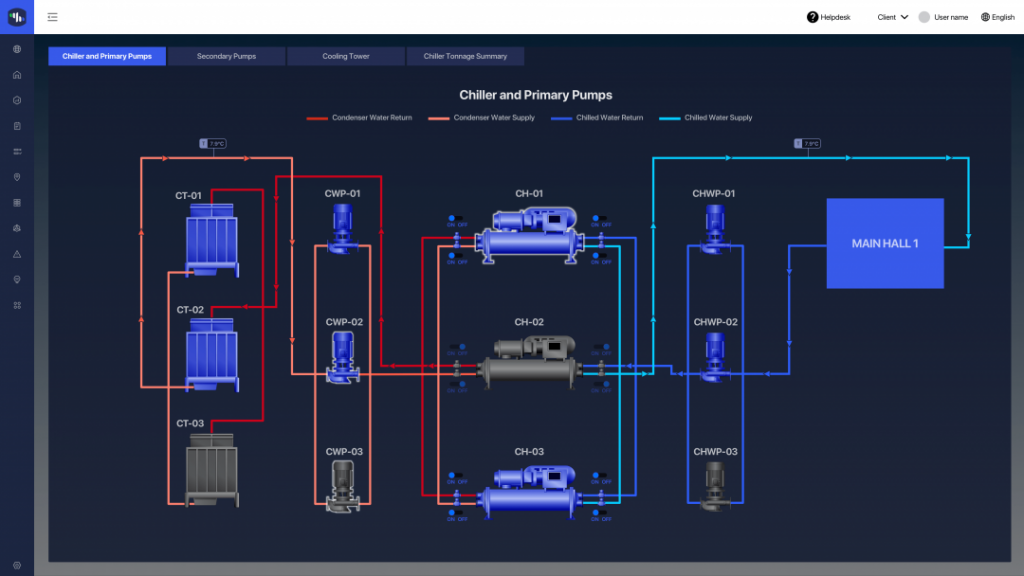
- Equipment System breakdown – Benchmarking what drives demand
Not all systems contribute equally to a building’s energy load. HVAC may dominate in one building, while pumps or industrial equipment dominate in another.
Akila visualizes consumption by equipment category so users can understand which systems are responsible for which portion of total demand.
This helps teams:
- Benchmark equipment performance against design values or peer buildings.
- Spot equipment types with recurring inefficiencies.
- Prioritize maintenance, upgrades, or operational tuning where it matters most.
- Detect early signs of equipment degradation through rising energy intensity.
Instead of looking at building-wide totals, operators get detailed clarity on what’s driving energy use.
Why this matters for the future of smart buildings
Energy Flow Analysis closes one of the biggest gaps in building management: the lack of a unified, intuitive, and actionable understanding of how energy moves through the built environment.
With this feature, teams can:
- Shift from reactive firefighting to predictive planning.
- Align sustainability and operations teams around shared, trusted data.
- Build more accurate forecasts and budgets.
- Support audits, compliance, and ESG reporting with confidence.
- Unlock new optimization pathways powered by AI and automation.
As buildings grow more complex and energy costs rise, this level of clarity is no longer a nice-to-have — it’s essential.


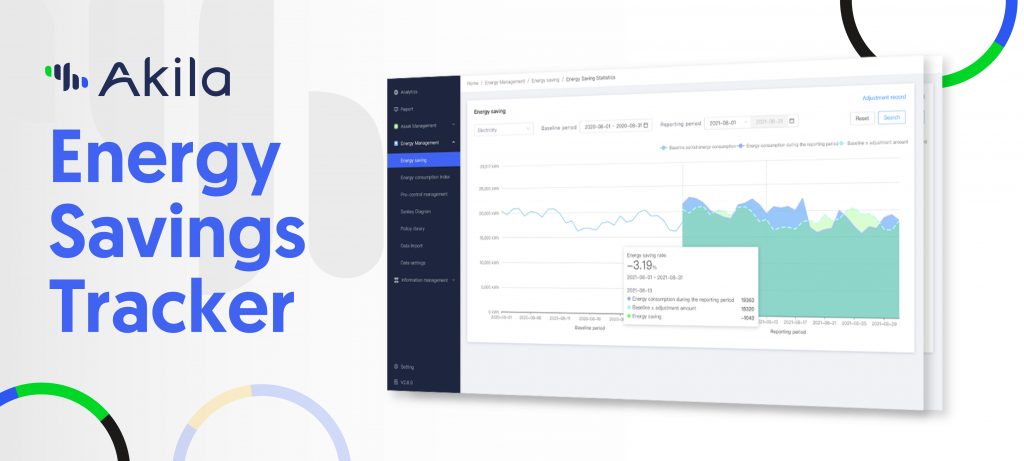
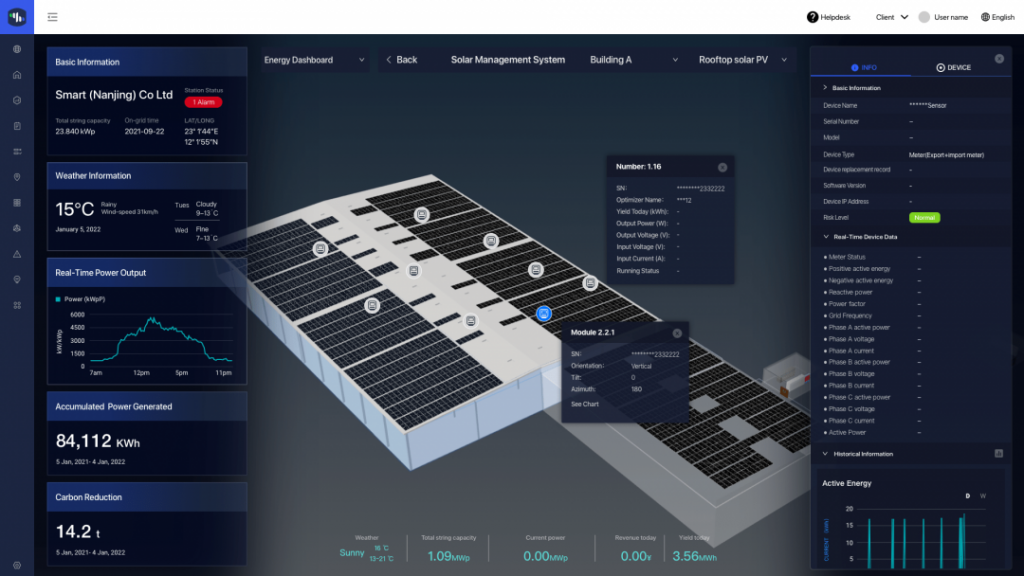 Solar microgrid management